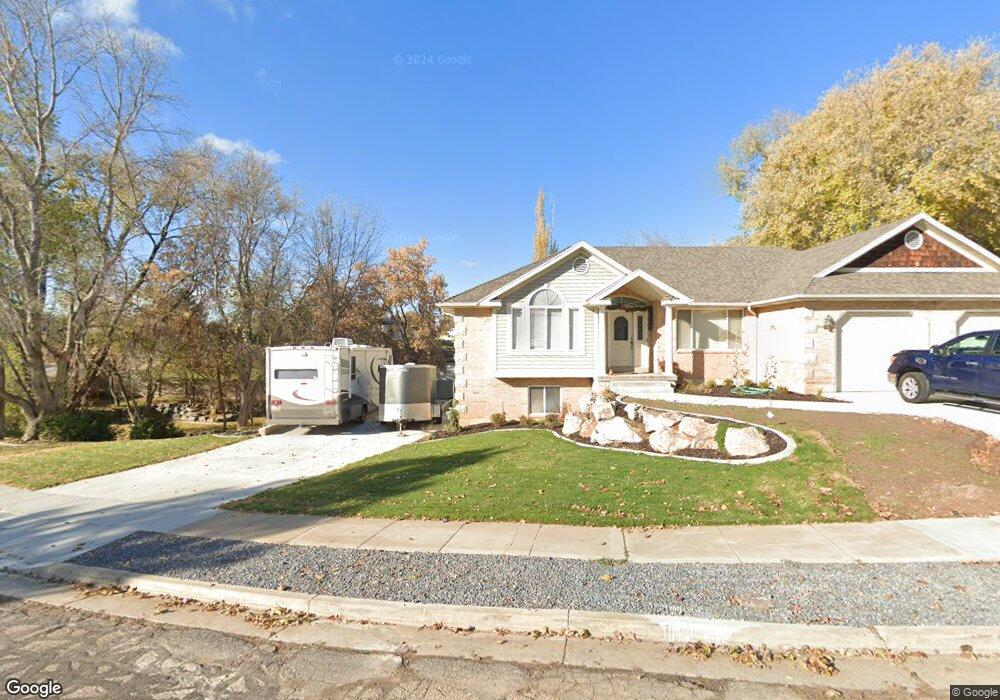
1149 E Hillsden Rd Layton, UT 84040
Estimated Value: $564,000 - $630,000
4
Beds
3
Baths
2,994
Sq Ft
$199/Sq Ft
Est. Value
About This Home
This home is located at 1149 E Hillsden Rd, Layton, UT 84040 and is currently estimated at $594,957, approximately $198 per square foot. 1149 E Hillsden Rd is a home located in Davis County with nearby schools including King Elementary School, Central Davis Junior High School, and Layton High School.
Ownership History
Date
Name
Owned For
Owner Type
Purchase Details
Closed on
May 18, 2023
Sold by
Revocable Trust
Bought by
Dowden Adam and Dowden Mindy
Current Estimated Value
Home Financials for this Owner
Home Financials are based on the most recent Mortgage that was taken out on this home.
Original Mortgage
$588,150
Outstanding Balance
$571,465
Interest Rate
6.28%
Mortgage Type
FHA
Estimated Equity
$23,492
Purchase Details
Closed on
Sep 27, 2019
Sold by
Huff Richard E and Huff Richard
Bought by
Huff Richard E and Revocable Trust Of Richard E H
Create a Home Valuation Report for This Property
The Home Valuation Report is an in-depth analysis detailing your home's value as well as a comparison with similar homes in the area
Home Values in the Area
Average Home Value in this Area
Purchase History
| Date | Buyer | Sale Price | Title Company |
|---|---|---|---|
| Dowden Adam | -- | None Listed On Document | |
| Huff Richard E | -- | None Available |
Source: Public Records
Mortgage History
| Date | Status | Borrower | Loan Amount |
|---|---|---|---|
| Open | Dowden Adam | $588,150 |
Source: Public Records
Tax History Compared to Growth
Tax History
| Year | Tax Paid | Tax Assessment Tax Assessment Total Assessment is a certain percentage of the fair market value that is determined by local assessors to be the total taxable value of land and additions on the property. | Land | Improvement |
|---|---|---|---|---|
| 2025 | $2,730 | $286,550 | $167,820 | $118,730 |
| 2024 | $2,533 | $267,850 | $179,641 | $88,209 |
| 2023 | $2,543 | $474,000 | $222,887 | $251,113 |
| 2022 | $2,674 | $270,600 | $121,197 | $149,403 |
| 2021 | $2,570 | $388,000 | $187,110 | $200,890 |
| 2020 | $2,348 | $340,000 | $162,521 | $177,479 |
| 2019 | $2,284 | $324,000 | $142,738 | $181,262 |
| 2018 | $2,121 | $302,000 | $120,164 | $181,836 |
| 2016 | $1,977 | $145,200 | $61,312 | $83,888 |
| 2015 | $2,100 | $146,465 | $61,312 | $85,153 |
| 2014 | $1,991 | $141,926 | $61,312 | $80,614 |
| 2013 | -- | $126,500 | $34,120 | $92,380 |
Source: Public Records
Map
Nearby Homes
- 580 N Allanwood Place
- 479 N 1375 E
- 508 N Adamswood Rd
- 1503 E 530 N
- 556 N Fairfield Rd Unit A2
- 556 N Fairfield Rd Unit D1
- 556 N Fairfield Rd Unit D2
- 556 N Fairfield Rd Unit A3
- 556 N Fairfield Rd Unit D3
- 556 N Fairfield Rd Unit D4
- 556 N Fairfield Rd Unit A1
- 556 N Fairfield Rd Unit A4
- 861 E 575 N
- 857 E 575 N
- 1247 E 300 N
- 880 E 350 N
- 654 Colonial St
- 1515 E Gentile St
- 794 Valeria Dr
- 942 E Gentile St
- 1149 Hillsden Rd
- 1124 E Hillsden Rd
- 1124 Hillsden Rd
- 1164 Hillsden Rd
- 1176 E Hillsden Rd
- 1187 Hillsden Rd
- 1118 E Snowcreek Dr
- 1110 E Snowcreek Dr
- 1176 Hillsden Rd
- 1131 E 575 N
- 1148 E Snowcreek Dr
- 580 N Franklin Rd
- 1126 E Snowcreek Dr
- 1192 Hillsden Rd
- 1109 E 575 N
- 1058 E Snowcreek Dr
- 675 N Colchester Ct
- 1210 Hillsden Rd
- 567 N Allanwood Place
- 672 Hope Cir