Estimated Value: $493,000 - $583,000
4
Beds
4
Baths
3,684
Sq Ft
$149/Sq Ft
Est. Value
About This Home
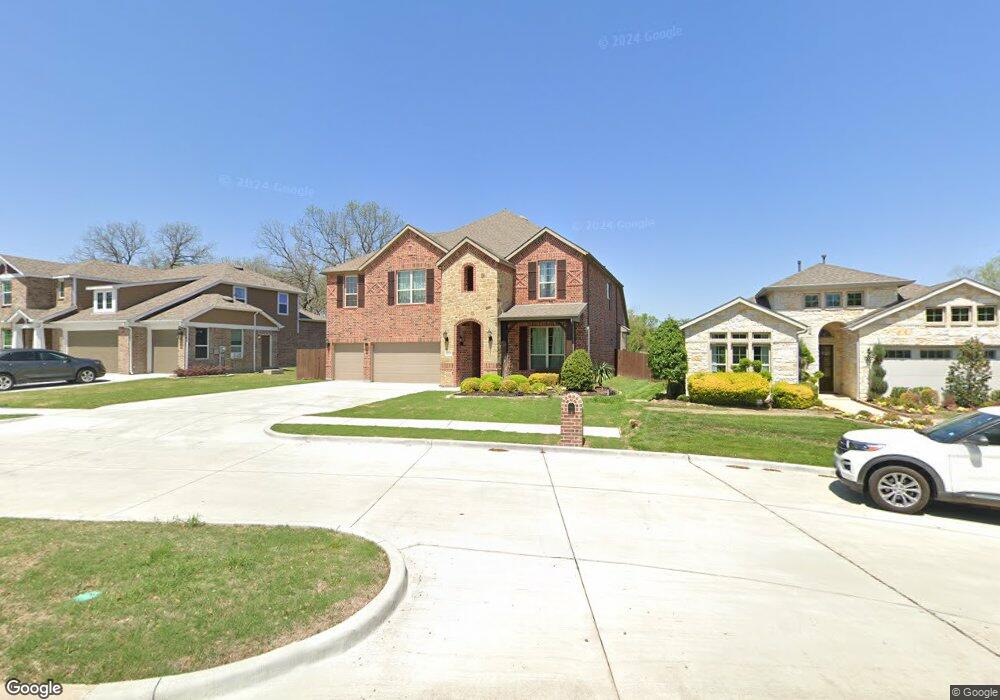
This home is located at 1149 W Collins Cir, Wylie, TX 75098 and is currently estimated at $547,393, approximately $148 per square foot. 1149 W Collins Cir is a home with nearby schools including Wally Watkins Elementary School, AB Harrison Intermediate School, and Grady Burnett J High School.
Ownership History
Date
Name
Owned For
Owner Type
Purchase Details
Closed on
Mar 4, 2022
Sold by
Onml Model Homes Lp
Bought by
Robinson Joni and Robinson Dequintus
Current Estimated Value
Purchase Details
Closed on
Aug 30, 2019
Sold by
Hmh Lifestyles Lp
Bought by
Inml Model Homes Lp
Home Financials for this Owner
Home Financials are based on the most recent Mortgage that was taken out on this home.
Original Mortgage
$3,300,000
Interest Rate
3.8%
Mortgage Type
Purchase Money Mortgage
Purchase Details
Closed on
Sep 19, 2014
Sold by
Development Solutions Bz Llc
Bought by
Hmh Lifestyles Lp
Home Financials for this Owner
Home Financials are based on the most recent Mortgage that was taken out on this home.
Original Mortgage
$20,000,000
Interest Rate
4.18%
Mortgage Type
Purchase Money Mortgage
Create a Home Valuation Report for This Property
The Home Valuation Report is an in-depth analysis detailing your home's value as well as a comparison with similar homes in the area
Home Values in the Area
Average Home Value in this Area
Purchase History
| Date | Buyer | Sale Price | Title Company |
|---|---|---|---|
| Robinson Joni | -- | None Listed On Document | |
| Inml Model Homes Lp | -- | Stewart | |
| Hmh Lifestyles Lp | -- | Stc |
Source: Public Records
Mortgage History
| Date | Status | Borrower | Loan Amount |
|---|---|---|---|
| Previous Owner | Inml Model Homes Lp | $3,300,000 | |
| Previous Owner | Hmh Lifestyles Lp | $20,000,000 |
Source: Public Records
Tax History Compared to Growth
Tax History
| Year | Tax Paid | Tax Assessment Tax Assessment Total Assessment is a certain percentage of the fair market value that is determined by local assessors to be the total taxable value of land and additions on the property. | Land | Improvement |
|---|---|---|---|---|
| 2025 | $9,809 | $584,165 | $105,000 | $479,165 |
| 2024 | $9,809 | $564,702 | $105,000 | $459,702 |
| 2023 | $9,809 | $575,706 | $100,000 | $475,706 |
| 2022 | $10,450 | $476,321 | $85,000 | $391,321 |
| 2021 | $9,755 | $414,606 | $75,000 | $339,606 |
| 2020 | $9,237 | $372,000 | $60,000 | $312,000 |
| 2019 | $8,024 | $305,341 | $46,800 | $258,541 |
| 2018 | $7,797 | $289,533 | $43,450 | $246,083 |
| 2017 | $7,431 | $275,950 | $43,450 | $232,500 |
| 2016 | $6,867 | $247,139 | $33,970 | $213,169 |
| 2015 | -- | $96,798 | $32,250 | $64,548 |
Source: Public Records
Map
Nearby Homes
- 1210 Iron Horse St
- 1318 Chestnut Hill Dr
- 1321 Iron Horse St
- 1316 Taren Trail
- 1318 Taren Trail
- 1320 Cedar Branch Dr
- 1201 E Stone Rd
- Oakhaven Plan at Alanis Crossing
- Valencia Plan at Alanis Crossing
- 800 Twin Oaks Dr
- 1503 E Collins Blvd
- 1323 Canyon Creek Rd
- 1330 Canyon Creek Rd
- 1500 Northwood Dr
- 306 Foxwood Ct
- 1605 Roberts Ravine Rd
- 407 Sparrow Dr
- 1613 Saddle Ridge Dr
- 825 Forest Edge Ln
- 314 Lake Texoma Dr
- 1151 W Collins Cir
- 1147 W Collins Cir
- 1145 W Collins Cir
- 1115 W Fm 544
- 1115 E Fm 544
- 930 Lorene Dr
- 1203 W Collins Cir
- 929 Alfred Dr
- 1185 E Fm 544
- 928 Lorene Dr
- 1205 W Collins Cir
- 1216 Iron Horse St
- 1214 Iron Horse St
- 1207 W Collins Cir
- 1218 Iron Horse St
- 1194 E Fm 544
- 927 Alfred Dr
- 1190 E Fm 544
- 1110 E Fm 544
- 1209 W Collins Cir