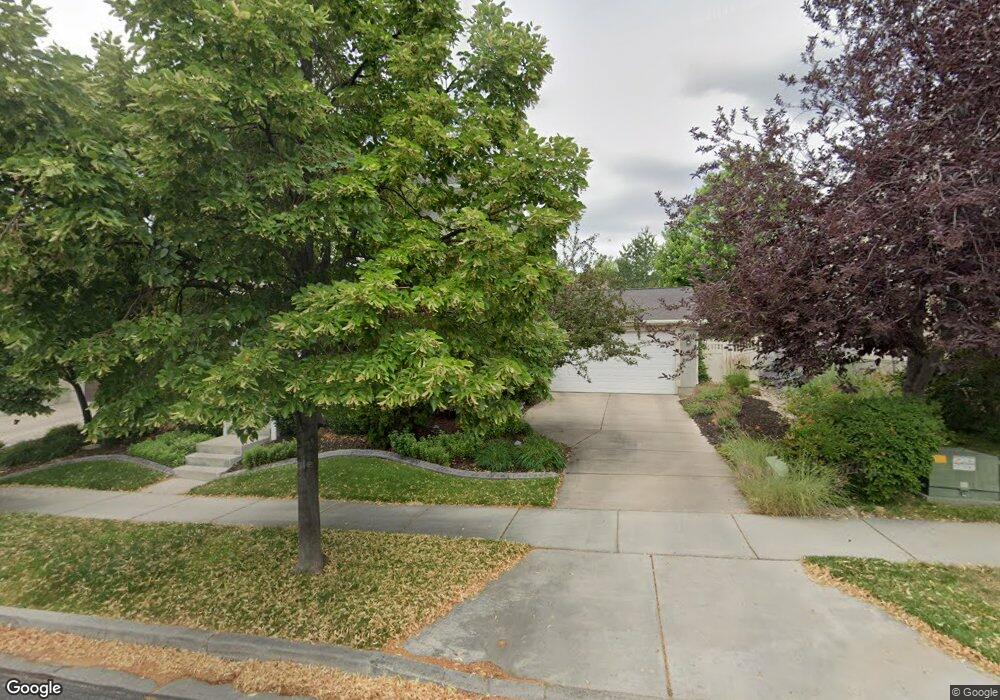
11496 S Harvest Rain Ave South Jordan, UT 84095
Daybreak NeighborhoodEstimated Value: $528,000 - $675,000
3
Beds
3
Baths
3,034
Sq Ft
$205/Sq Ft
Est. Value
About This Home
This home is located at 11496 S Harvest Rain Ave, South Jordan, UT 84095 and is currently estimated at $621,685, approximately $204 per square foot. 11496 S Harvest Rain Ave is a home located in Salt Lake County with nearby schools including Daybreak Elementary School, Mountain Creek Middle School, and Herriman High School.
Ownership History
Date
Name
Owned For
Owner Type
Purchase Details
Closed on
Jun 2, 2009
Sold by
Horn Thomas and Whitworth Shaunda
Bought by
Clyde Ronald F and Clyde Lisa M
Current Estimated Value
Purchase Details
Closed on
Jun 28, 2005
Sold by
Gold Medallion Custom Homes Lc
Bought by
Horn Thomas and Whitworth Shaunda
Home Financials for this Owner
Home Financials are based on the most recent Mortgage that was taken out on this home.
Original Mortgage
$212,056
Interest Rate
5.65%
Mortgage Type
Fannie Mae Freddie Mac
Purchase Details
Closed on
Nov 23, 2004
Sold by
Kennecott Land Residential Development C
Bought by
Gold Medallion Custom Homes Lc
Create a Home Valuation Report for This Property
The Home Valuation Report is an in-depth analysis detailing your home's value as well as a comparison with similar homes in the area
Home Values in the Area
Average Home Value in this Area
Purchase History
| Date | Buyer | Sale Price | Title Company |
|---|---|---|---|
| Clyde Ronald F | -- | Advanced Title Slc | |
| Horn Thomas | -- | United Title Services | |
| Gold Medallion Custom Homes Lc | -- | First American Title |
Source: Public Records
Mortgage History
| Date | Status | Borrower | Loan Amount |
|---|---|---|---|
| Previous Owner | Horn Thomas | $212,056 |
Source: Public Records
Tax History Compared to Growth
Tax History
| Year | Tax Paid | Tax Assessment Tax Assessment Total Assessment is a certain percentage of the fair market value that is determined by local assessors to be the total taxable value of land and additions on the property. | Land | Improvement |
|---|---|---|---|---|
| 2025 | $2,969 | $569,500 | $102,300 | $467,200 |
| 2024 | $2,969 | $563,700 | $99,300 | $464,400 |
| 2023 | $3,087 | $553,000 | $96,400 | $456,600 |
| 2022 | $3,180 | $558,300 | $94,500 | $463,800 |
| 2021 | $2,439 | $393,000 | $72,800 | $320,200 |
| 2020 | $2,338 | $353,100 | $68,600 | $284,500 |
| 2019 | $2,324 | $344,900 | $68,600 | $276,300 |
| 2018 | $2,196 | $324,300 | $67,600 | $256,700 |
| 2017 | $2,083 | $301,500 | $67,600 | $233,900 |
| 2016 | $2,099 | $287,900 | $64,200 | $223,700 |
| 2015 | $1,956 | $260,900 | $78,400 | $182,500 |
| 2014 | $1,879 | $246,300 | $91,300 | $155,000 |
Source: Public Records
Map
Nearby Homes
- 11491 Harvest Crest Way
- 4536 W Silent Rain Dr
- 4555 W Open Hill Dr
- 11347 S Kestrel Rise Rd
- 4491 W Daybreak Rim Way
- 4463 W Harvest Sun Ln
- 4454 W 11800 S
- 4466 W 11800 S
- 4629 W Daybreak Rim Way
- 4144 W Foxview Dr
- 4586 W Daybreak Rim Way Unit 396
- 4584 W Daybreak Rim Way
- 4347 W 11770 S
- 11381 Skylux Ave
- 11429 S Oakmond Rd
- 11211 S Clear Blue Dr
- 11411 S Oakmond Rd
- 11777 S 4210 W
- 4774 W Daybreak Rim Way
- 4811 W Daybreak Pkwy
- 11496 Harvest Rain Ave
- 11508 Harvest Rain Ave
- 11508 S Harvest Rain Ave
- 11488 S Harvest Rain Ave
- 11488 Harvest Rain Ave
- 11499 Harvest Crest Way
- 11499 Harvest Crest Way Unit 215
- 11499 S Harvest Crest Way Unit 215
- 11499 S Harvest Crest Way
- 11509 Harvest Crest Way
- 11476 S Harvest Rain Ave
- 11476 Harvest Rain Ave
- 11518 Harvest Rain Ave
- 11483 S Harvest
- 11483 S Harvest Crest Way
- 11483 Harvest Crest Way
- 11519 Harvest Crest Way
- 11519 S Harvest Crest Way
- 11497 Harvest Rain Ave
- 11497 S Harvest Rain Ave