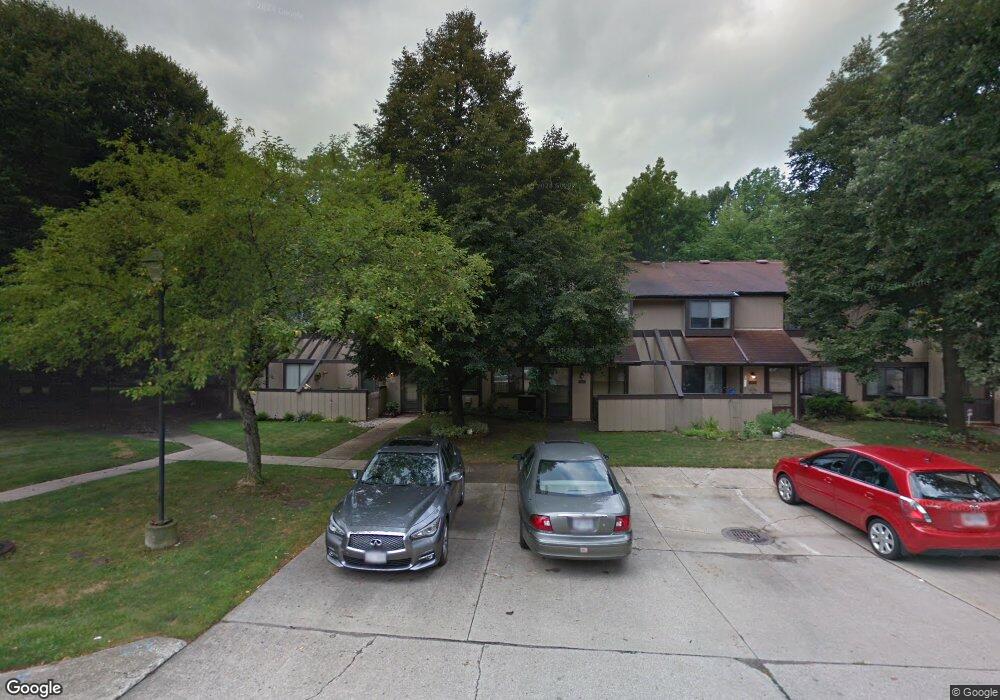
11497 Harbour Light Dr North Royalton, OH 44133
Estimated Value: $168,000 - $172,024
2
Beds
2
Baths
1,224
Sq Ft
$138/Sq Ft
Est. Value
About This Home
This home is located at 11497 Harbour Light Dr, North Royalton, OH 44133 and is currently estimated at $169,256, approximately $138 per square foot. 11497 Harbour Light Dr is a home located in Cuyahoga County with nearby schools including North Royalton Middle School, North Royalton High School, and Royal Redeemer Lutheran School.
Ownership History
Date
Name
Owned For
Owner Type
Purchase Details
Closed on
Oct 22, 1997
Sold by
Mason Deborah A
Bought by
Kwiatkowski David A and Kwiatkowski Philomena R
Current Estimated Value
Home Financials for this Owner
Home Financials are based on the most recent Mortgage that was taken out on this home.
Original Mortgage
$69,300
Outstanding Balance
$11,330
Interest Rate
7.65%
Mortgage Type
New Conventional
Estimated Equity
$157,926
Purchase Details
Closed on
Oct 31, 1985
Sold by
Rizzardi Gary A
Bought by
Lee Deborah A
Purchase Details
Closed on
Jun 28, 1984
Sold by
Straub Paul A
Bought by
Rizzardi Gary A
Purchase Details
Closed on
Jun 12, 1981
Sold by
Barno Gerald A
Bought by
Straub Paul A
Purchase Details
Closed on
Mar 23, 1979
Sold by
Karoly John C and Filo M
Bought by
Barno Gerald A
Purchase Details
Closed on
Jan 1, 1978
Bought by
Karoly John C and Karoly Filo M
Create a Home Valuation Report for This Property
The Home Valuation Report is an in-depth analysis detailing your home's value as well as a comparison with similar homes in the area
Home Values in the Area
Average Home Value in this Area
Purchase History
| Date | Buyer | Sale Price | Title Company |
|---|---|---|---|
| Kwiatkowski David A | $77,000 | -- | |
| Lee Deborah A | $51,000 | -- | |
| Rizzardi Gary A | -- | -- | |
| Rizzardi Gary A | $49,000 | -- | |
| Straub Paul A | $48,500 | -- | |
| Barno Gerald A | $43,000 | -- | |
| Karoly John C | -- | -- |
Source: Public Records
Mortgage History
| Date | Status | Borrower | Loan Amount |
|---|---|---|---|
| Open | Kwiatkowski David A | $69,300 |
Source: Public Records
Tax History Compared to Growth
Tax History
| Year | Tax Paid | Tax Assessment Tax Assessment Total Assessment is a certain percentage of the fair market value that is determined by local assessors to be the total taxable value of land and additions on the property. | Land | Improvement |
|---|---|---|---|---|
| 2024 | $2,861 | $48,195 | $4,830 | $43,365 |
| 2023 | $2,122 | $32,800 | $3,290 | $29,510 |
| 2022 | $2,108 | $32,800 | $3,290 | $29,510 |
| 2021 | $2,132 | $32,800 | $3,290 | $29,510 |
| 2020 | $1,700 | $24,850 | $2,490 | $22,370 |
| 2019 | $1,651 | $71,000 | $7,100 | $63,900 |
| 2018 | $1,611 | $24,850 | $2,490 | $22,370 |
| 2017 | $1,653 | $23,490 | $2,350 | $21,140 |
| 2016 | $1,552 | $23,490 | $2,350 | $21,140 |
| 2015 | $1,955 | $23,490 | $2,350 | $21,140 |
| 2014 | $1,955 | $29,370 | $2,940 | $26,430 |
Source: Public Records
Map
Nearby Homes
- 11445 Harbour Light Dr
- 11650 Harbour Light Dr Unit 1650
- 9821 Sunrise Blvd Unit o1
- 10560 Independence Dr Unit 25A
- 9800 Cove Dr Unit H2
- 11806 Harbour Light Dr Unit 1806
- 9761 Sunrise Blvd
- 10364 Independence Dr Unit 19c
- 9710 Cove Dr Unit 23G
- 10342 Independence Dr Unit 21B
- 9660 Cove Dr Unit F13
- 9630 Cove Dr Unit A-14
- 9611 Sunrise Blvd Unit K2
- 9530 Cove Dr Unit C-25
- 9510 Cove Dr Unit C12
- 11550 York Rd
- 10641 Albion Rd
- 10700 Abbey Rd
- 9035 Wallings Rd
- 9938 Abbey Rd
- 11495 Harbour Light Dr Unit 1495
- 11477 Harbour Light Dr Unit 1477
- 11489 Harbour Light Dr Unit 1489
- 11499 Harbour Light Dr Unit 1499
- 11495 Harbour Light Dr
- 11481 Harbour Light Dr Unit 1481
- 11493 Harbour Light Dr Unit 1493
- 11491 Harbour Light Dr
- 11473 Harbour Light Dr
- 11475 Harbour Light Dr
- 11479 Harbour Light Dr
- 11483 Harbour Light Dr
- 11485 Harbour Light Dr
- 11495 Harbour Light Dr Unit 11495
- 11487 Harbour Light Dr
- 11447 Harbour Light Dr Unit 1447
- 11463 Harbour Light Dr Unit 1463
- 11449 Harbour Light Dr Unit 1449
- 11465 Harbour Light Dr Unit 1465
- 11459 Harbour Light Dr Unit 1459