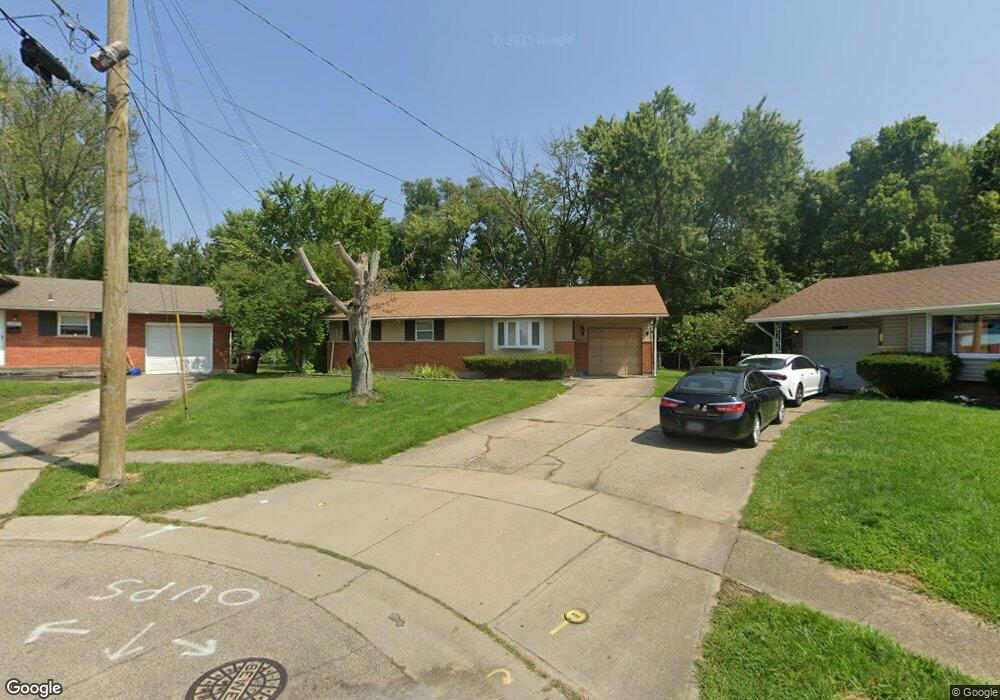
11498 Gresham Place Cincinnati, OH 45240
Estimated Value: $163,000 - $203,000
3
Beds
1
Bath
1,131
Sq Ft
$162/Sq Ft
Est. Value
About This Home
This home is located at 11498 Gresham Place, Cincinnati, OH 45240 and is currently estimated at $183,407, approximately $162 per square foot. 11498 Gresham Place is a home located in Hamilton County with nearby schools including Calvary Academy- The and St Gabriel Consolidated School.
Ownership History
Date
Name
Owned For
Owner Type
Purchase Details
Closed on
Oct 5, 2023
Sold by
Guan Xiaoqun
Bought by
Roblero Selvin Fidel Perez
Current Estimated Value
Purchase Details
Closed on
Sep 22, 2023
Sold by
Kdn Real Property Ii Llc
Bought by
Guan Xiaoqun
Purchase Details
Closed on
Oct 15, 2018
Sold by
Niehaus Keith and Niehaus Keith D
Bought by
Kdn Real Property Ii Llc
Purchase Details
Closed on
Feb 14, 2005
Sold by
Bourgeois Mary and Bourgeois Gail
Bought by
Niehaus Keith
Purchase Details
Closed on
Feb 11, 2000
Sold by
Bourgeois Mary F
Bought by
Bourgeois Mary F and Bourgeois Gail
Home Financials for this Owner
Home Financials are based on the most recent Mortgage that was taken out on this home.
Original Mortgage
$107,000
Interest Rate
8.21%
Mortgage Type
Balloon
Create a Home Valuation Report for This Property
The Home Valuation Report is an in-depth analysis detailing your home's value as well as a comparison with similar homes in the area
Home Values in the Area
Average Home Value in this Area
Purchase History
| Date | Buyer | Sale Price | Title Company |
|---|---|---|---|
| Roblero Selvin Fidel Perez | $156,000 | None Listed On Document | |
| Roblero Selvin Fidel Perez | $156,000 | None Listed On Document | |
| Guan Xiaoqun | $136,000 | None Listed On Document | |
| Guan Xiaoqun | $136,000 | None Listed On Document | |
| Kdn Real Property Ii Llc | -- | None Available | |
| Niehaus Keith | $69,701 | None Available | |
| Bourgeois Mary F | -- | -- |
Source: Public Records
Mortgage History
| Date | Status | Borrower | Loan Amount |
|---|---|---|---|
| Previous Owner | Bourgeois Mary F | $107,000 |
Source: Public Records
Tax History
| Year | Tax Paid | Tax Assessment Tax Assessment Total Assessment is a certain percentage of the fair market value that is determined by local assessors to be the total taxable value of land and additions on the property. | Land | Improvement |
|---|---|---|---|---|
| 2025 | $3,062 | $52,042 | $10,710 | $41,332 |
| 2024 | $2,980 | $52,042 | $10,710 | $41,332 |
| 2023 | $3,133 | $52,042 | $10,710 | $41,332 |
| 2022 | $2,516 | $31,703 | $8,225 | $23,478 |
| 2021 | $2,508 | $31,703 | $8,225 | $23,478 |
| 2020 | $2,477 | $31,703 | $8,225 | $23,478 |
| 2019 | $2,362 | $26,418 | $6,853 | $19,565 |
| 2018 | $2,365 | $26,418 | $6,853 | $19,565 |
| 2017 | $2,306 | $26,418 | $6,853 | $19,565 |
| 2016 | $1,732 | $19,251 | $8,467 | $10,784 |
| 2015 | $1,631 | $19,251 | $8,467 | $10,784 |
| 2014 | $1,472 | $19,251 | $8,467 | $10,784 |
| 2013 | $1,441 | $19,251 | $8,467 | $10,784 |
Source: Public Records
Map
Nearby Homes
- 11481 Fremantle Dr
- 920 Waycross Rd
- 11639 Hanover Rd
- 694 Park Ave
- 11833 Fairsprings Ct
- 604 Smiley Ave
- 11839 Hamlet Rd
- 805 Halesworth Dr
- 22 Oakwood Ct
- 11570 Rose Ln
- 993 Havensport Dr
- 10 Woodside Ct
- 612 Brightview Place Unit 30
- 614 Brightview Place Unit 29
- 626 Brightview Place Unit 24
- 622 Brightview Place Unit 26
- 620 Brightview Place Unit 27
- 624 Brightview Place Unit 25
- 602 Brightview Place Unit 34
- 888 W Kemper Rd
- 11490 Gresham Place
- 11497 Gresham Place
- 884 Fairborn Rd
- 880 Fairborn Rd
- 11482 Gresham Place
- 11489 Gresham Place
- 890 Fairborn Rd
- 874 Fairborn Rd
- 11477 Gresham Place
- 11477 Farmington Rd
- 11465 Farmington Rd
- 11483 Farmington Rd
- 11459 Farmington Rd
- 872 Glasgow Dr
- 11469 Gresham Place
- 876 Glasgow Dr
- 868 Glasgow Dr
- 870 Fairborn Rd
- 11466 Gresham Place
- 894 Fairborn Rd
Your Personal Tour Guide
Ask me questions while you tour the home.