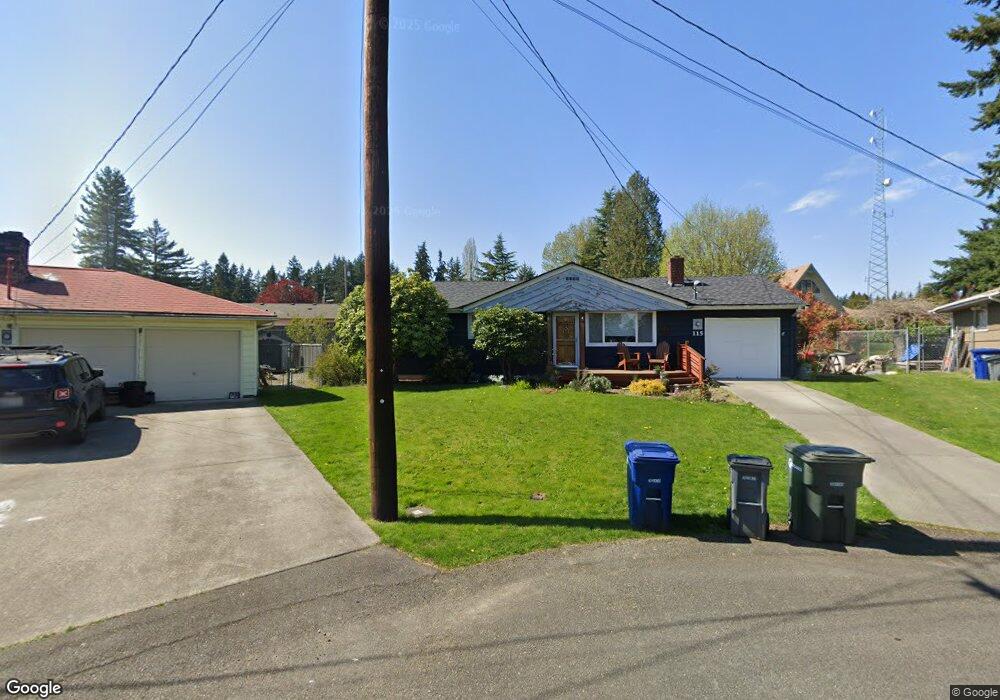
115 233rd Place SW Bothell, WA 98021
Queensborough-Brentwood NeighborhoodEstimated Value: $711,000 - $792,000
3
Beds
2
Baths
1,310
Sq Ft
$563/Sq Ft
Est. Value
About This Home
This home is located at 115 233rd Place SW, Bothell, WA 98021 and is currently estimated at $737,012, approximately $562 per square foot. 115 233rd Place SW is a home located in Snohomish County with nearby schools including Shelton View Elementary School, Canyon Park Junior High School, and Bothell High School.
Ownership History
Date
Name
Owned For
Owner Type
Purchase Details
Closed on
Sep 6, 2011
Sold by
Alger Jennife Rl and Alger Daniel
Bought by
Kiley Rebekka C and Kiley Daniel P
Current Estimated Value
Home Financials for this Owner
Home Financials are based on the most recent Mortgage that was taken out on this home.
Original Mortgage
$195,850
Outstanding Balance
$132,586
Interest Rate
4.48%
Mortgage Type
New Conventional
Estimated Equity
$604,426
Purchase Details
Closed on
Feb 26, 2007
Sold by
Monson Justin and Monson Kori
Bought by
Stetson Jennifer L
Home Financials for this Owner
Home Financials are based on the most recent Mortgage that was taken out on this home.
Original Mortgage
$72,000
Interest Rate
6.21%
Mortgage Type
Stand Alone Second
Purchase Details
Closed on
Jun 15, 2004
Sold by
Reddy Moira G
Bought by
Monson Justin and Monson Kori
Home Financials for this Owner
Home Financials are based on the most recent Mortgage that was taken out on this home.
Original Mortgage
$233,830
Interest Rate
6.29%
Mortgage Type
FHA
Create a Home Valuation Report for This Property
The Home Valuation Report is an in-depth analysis detailing your home's value as well as a comparison with similar homes in the area
Home Values in the Area
Average Home Value in this Area
Purchase History
| Date | Buyer | Sale Price | Title Company |
|---|---|---|---|
| Kiley Rebekka C | $216,146 | Cw Title | |
| Stetson Jennifer L | $360,280 | Multiple | |
| Monson Justin | $237,500 | Chicago Title |
Source: Public Records
Mortgage History
| Date | Status | Borrower | Loan Amount |
|---|---|---|---|
| Open | Kiley Rebekka C | $195,850 | |
| Previous Owner | Stetson Jennifer L | $72,000 | |
| Previous Owner | Stetson Jennifer L | $288,000 | |
| Previous Owner | Monson Justin | $233,830 |
Source: Public Records
Tax History
| Year | Tax Paid | Tax Assessment Tax Assessment Total Assessment is a certain percentage of the fair market value that is determined by local assessors to be the total taxable value of land and additions on the property. | Land | Improvement |
|---|---|---|---|---|
| 2026 | $5,538 | $715,600 | $558,000 | $157,600 |
| 2025 | $5,174 | $648,300 | $495,000 | $153,300 |
| 2024 | $5,174 | $603,300 | $445,000 | $158,300 |
| 2023 | $6,120 | $785,600 | $600,000 | $185,600 |
| 2022 | $5,576 | $577,400 | $420,000 | $157,400 |
| 2020 | $4,749 | $454,600 | $293,000 | $161,600 |
| 2019 | $4,305 | $426,500 | $260,000 | $166,500 |
| 2018 | $3,851 | $366,500 | $225,000 | $141,500 |
| 2017 | $3,226 | $309,000 | $179,000 | $130,000 |
| 2016 | $2,858 | $281,900 | $157,000 | $124,900 |
| 2015 | $2,781 | $260,100 | $149,000 | $111,100 |
| 2013 | $2,483 | $203,900 | $116,000 | $87,900 |
Source: Public Records
Map
Nearby Homes
- 18 232nd Place SW
- 17 232nd Place SE
- 22827 Meridian Ave S
- 23619 5th Ave W
- 404 228th St SW Unit E101
- 22619 4th Ave W Unit 3-103
- 714 228th St SW Unit O101
- 23826 7th Place W
- 23716 9th Place W
- 931 236th Place SW
- 1017 236th Place SW
- 23812 Lake Dr E
- 24123 7th Ave W
- 610 237th Place SE Unit B
- 242 xx 7th Ave SE
- 524 238th Place SE Unit C
- 24114 7th Place W
- 23712 8th Dr SE Unit B
- 23712 8th Dr SE Unit E
- 23431 9th Ave SE Unit 30
- 109 233rd Place SW
- 23229 2nd Ave W
- 118 233rd Place SW
- 118 233rd Place SW Unit 23
- 23305 2nd Ave W
- 23221 2nd Ave W
- 110 233rd Place SW
- 101 233rd Place SW
- 106 232nd Place SW
- 100 232nd Place SW
- 23311 2nd Ave W
- 102 233rd Place SW
- 123 234th St SW
- 23224 2nd Ave W
- 111 234th St SW
- 23319 2nd Ave W
- 103 234th St SW
- 105 232nd Place SW
- 131 234th St SW
- 23312 2nd Ave W
Your Personal Tour Guide
Ask me questions while you tour the home.