Estimated Value: $223,000 - $252,000
3
Beds
2
Baths
1,380
Sq Ft
$170/Sq Ft
Est. Value
About This Home
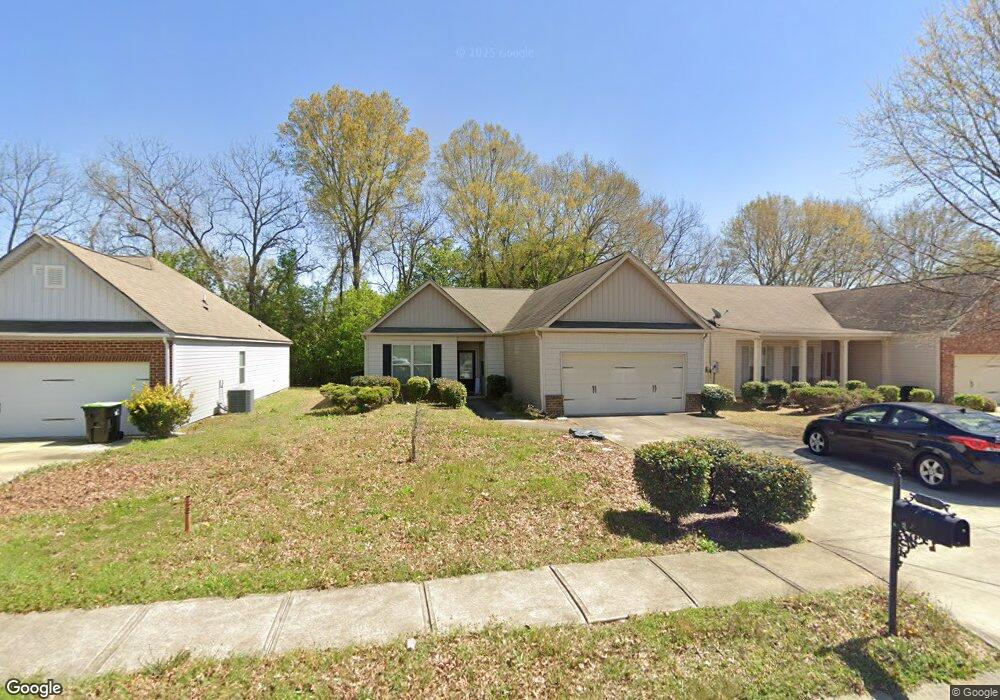
This home is located at 115 Abelia Ln, Byron, GA 31008 and is currently estimated at $233,955, approximately $169 per square foot. 115 Abelia Ln is a home located in Peach County with nearby schools including Kay Road Elementary School, Fort Valley Middle School, and Peach County High School.
Ownership History
Date
Name
Owned For
Owner Type
Purchase Details
Closed on
Aug 30, 2019
Sold by
Torgormey Jason L
Bought by
Stripling Ashley
Current Estimated Value
Home Financials for this Owner
Home Financials are based on the most recent Mortgage that was taken out on this home.
Original Mortgage
$132,222
Outstanding Balance
$115,045
Interest Rate
3.7%
Estimated Equity
$118,910
Purchase Details
Closed on
Jul 20, 2010
Sold by
D R Horton Inc
Bought by
Torgormey Jason L
Home Financials for this Owner
Home Financials are based on the most recent Mortgage that was taken out on this home.
Original Mortgage
$120,315
Interest Rate
4.4%
Mortgage Type
FHA
Purchase Details
Closed on
Mar 4, 2010
Sold by
Peachtree Five Capital Llc
Bought by
R Horton I Nc D
Purchase Details
Closed on
Jun 19, 2006
Bought by
Peachtree Five Capital Llc
Create a Home Valuation Report for This Property
The Home Valuation Report is an in-depth analysis detailing your home's value as well as a comparison with similar homes in the area
Home Values in the Area
Average Home Value in this Area
Purchase History
| Date | Buyer | Sale Price | Title Company |
|---|---|---|---|
| Stripling Ashley | $130,000 | -- | |
| Torgormey Jason L | $121,936 | -- | |
| R Horton I Nc D | -- | -- | |
| Peachtree Five Capital Llc | -- | -- |
Source: Public Records
Mortgage History
| Date | Status | Borrower | Loan Amount |
|---|---|---|---|
| Open | Stripling Ashley | $132,222 | |
| Previous Owner | Torgormey Jason L | $120,315 |
Source: Public Records
Tax History
| Year | Tax Paid | Tax Assessment Tax Assessment Total Assessment is a certain percentage of the fair market value that is determined by local assessors to be the total taxable value of land and additions on the property. | Land | Improvement |
|---|---|---|---|---|
| 2025 | $2,444 | $78,920 | $13,200 | $65,720 |
| 2024 | $2,554 | $71,560 | $13,000 | $58,560 |
| 2023 | $2,484 | $69,160 | $10,400 | $58,760 |
| 2022 | $1,667 | $61,920 | $10,400 | $51,520 |
| 2021 | $1,652 | $52,920 | $10,400 | $42,520 |
| 2020 | $1,580 | $50,600 | $10,400 | $40,200 |
| 2019 | $1,525 | $50,600 | $10,400 | $40,200 |
| 2018 | $1,466 | $48,480 | $10,400 | $38,080 |
| 2017 | $1,473 | $48,480 | $10,400 | $38,080 |
| 2016 | $1,467 | $48,480 | $10,400 | $38,080 |
| 2015 | $1,469 | $48,480 | $10,400 | $38,080 |
| 2014 | $1,471 | $48,480 | $10,400 | $38,080 |
| 2013 | -- | $48,480 | $10,400 | $38,080 |
Source: Public Records
Map
Nearby Homes
- 109 Abelia Ln
- 112 Abelia Ln
- 104 Chickasaw Ct
- 360 Walker Rd
- 121 Bluecoat Trail
- 119 Bluecoat Trail
- 124 Bluecoat Trail
- 120 Bluecoat Trail
- 122 Bluecoat Trail
- 114 Meadows Walk Dr
- 212 Eric Ct
- 121 Early Dr
- 202 Eric Ct
- 106 Early Dr
- 104 Early Dr
- 113 Early Dr
- 100 Early Dr
- 103 Early Dr
- 208 Eric Ct
- 126 Early Dr
- 115 Abelia Ln Unit /8
- 117 Abelia Ln
- 113 Abelia Ln
- 119 Abelia Ln
- 0 Abelia Ln Unit LOT 9 02913225
- 0 Abelia Ln Unit LOT 30 02913166
- 0 Abelia Ln Unit LOT 29 02914512
- 0 Abelia Ln Unit LOT 31 02907428
- 111 Abelia Ln
- 400 Walker Rd
- 121 Abelia Ln
- 110 Abelia Ln
- 109 Abelia Ln Unit LOT5
- 112 Abelia Lane (31)
- 109 Abelia Lane(5)
- 123 Abelia Ln
- 108 Abelia Ln
- 114 Abelia Lane (30)
- 107 Abelia Ln
- 107 Abelia Ln Unit LOT 4
Your Personal Tour Guide
Ask me questions while you tour the home.