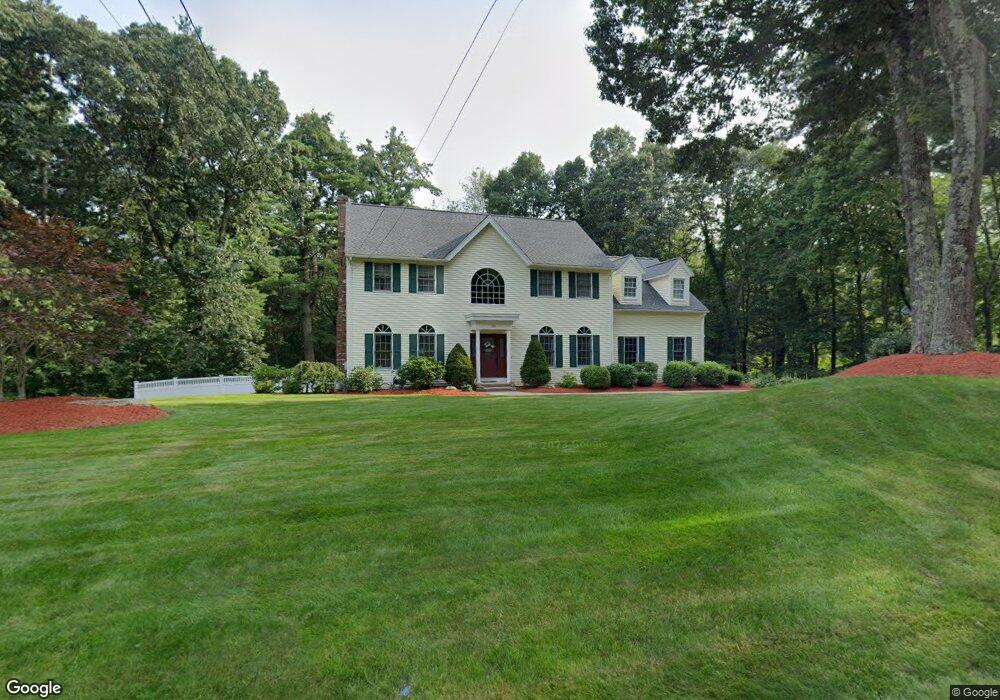
115 Adams St Westborough, MA 01581
Estimated Value: $1,038,000 - $1,179,000
4
Beds
3
Baths
2,906
Sq Ft
$377/Sq Ft
Est. Value
About This Home
This home is located at 115 Adams St, Westborough, MA 01581 and is currently estimated at $1,094,560, approximately $376 per square foot. 115 Adams St is a home located in Worcester County with nearby schools including Westborough High School and Ebridge Montessori School.
Ownership History
Date
Name
Owned For
Owner Type
Purchase Details
Closed on
Sep 24, 2018
Sold by
Gardner Peter and Casserly-Gardner Kelly A
Bought by
Kelly & Peter Gardner Lt
Current Estimated Value
Purchase Details
Closed on
Jan 17, 1991
Sold by
Casa Bldrs & Dev
Bought by
Casserly Kelly A
Create a Home Valuation Report for This Property
The Home Valuation Report is an in-depth analysis detailing your home's value as well as a comparison with similar homes in the area
Home Values in the Area
Average Home Value in this Area
Purchase History
| Date | Buyer | Sale Price | Title Company |
|---|---|---|---|
| Kelly & Peter Gardner Lt | -- | -- | |
| Casserly Kelly A | $269,429 | -- |
Source: Public Records
Mortgage History
| Date | Status | Borrower | Loan Amount |
|---|---|---|---|
| Previous Owner | Casserly Kelly A | $75,000 | |
| Previous Owner | Casserly Kelly A | $15,000 | |
| Previous Owner | Casserly Kelly A | $58,500 | |
| Previous Owner | Casserly Kelly A | $202,300 |
Source: Public Records
Tax History Compared to Growth
Tax History
| Year | Tax Paid | Tax Assessment Tax Assessment Total Assessment is a certain percentage of the fair market value that is determined by local assessors to be the total taxable value of land and additions on the property. | Land | Improvement |
|---|---|---|---|---|
| 2025 | $14,703 | $902,600 | $376,400 | $526,200 |
| 2024 | $14,052 | $856,300 | $359,000 | $497,300 |
| 2023 | $13,541 | $804,100 | $339,400 | $464,700 |
| 2022 | $12,812 | $692,900 | $285,000 | $407,900 |
| 2021 | $11,997 | $647,100 | $239,200 | $407,900 |
| 2020 | $11,622 | $634,400 | $237,100 | $397,300 |
| 2019 | $11,211 | $611,600 | $247,900 | $363,700 |
| 2018 | $10,430 | $565,000 | $237,100 | $327,900 |
| 2017 | $10,057 | $565,000 | $237,100 | $327,900 |
| 2016 | $9,651 | $543,100 | $232,700 | $310,400 |
| 2015 | $9,472 | $509,500 | $219,600 | $289,900 |
Source: Public Records
Map
Nearby Homes