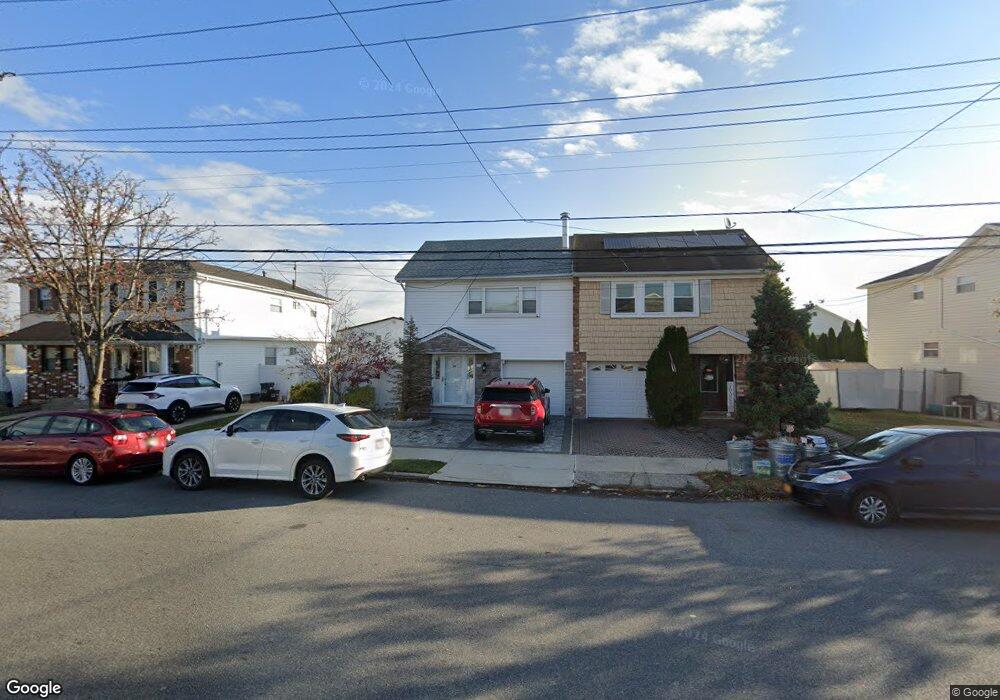
115 Annadale Rd Staten Island, NY 10312
Arden Heights NeighborhoodEstimated Value: $843,860 - $915,000
4
Beds
3
Baths
2,088
Sq Ft
$415/Sq Ft
Est. Value
About This Home
This home is located at 115 Annadale Rd, Staten Island, NY 10312 and is currently estimated at $865,965, approximately $414 per square foot. 115 Annadale Rd is a home located in Richmond County with nearby schools including P.S. 42 The Eltingville School, I.S. 075 Frank D. Paulo, and Tottenville High School.
Ownership History
Date
Name
Owned For
Owner Type
Purchase Details
Closed on
Feb 19, 2010
Sold by
Colli Romolo
Bought by
Colli Romolo and Colli Denise
Current Estimated Value
Purchase Details
Closed on
Jul 16, 2009
Sold by
Brandt Ann
Bought by
Colli Romolo
Home Financials for this Owner
Home Financials are based on the most recent Mortgage that was taken out on this home.
Original Mortgage
$411,300
Interest Rate
5.06%
Mortgage Type
New Conventional
Purchase Details
Closed on
Nov 17, 2003
Sold by
Brandt Owen and Brandt Ann
Bought by
Brandt Ann
Create a Home Valuation Report for This Property
The Home Valuation Report is an in-depth analysis detailing your home's value as well as a comparison with similar homes in the area
Home Values in the Area
Average Home Value in this Area
Purchase History
| Date | Buyer | Sale Price | Title Company |
|---|---|---|---|
| Colli Romolo | -- | None Available | |
| Colli Romolo | $457,000 | None Available | |
| Brandt Ann | -- | None Available |
Source: Public Records
Mortgage History
| Date | Status | Borrower | Loan Amount |
|---|---|---|---|
| Previous Owner | Colli Romolo | $411,300 |
Source: Public Records
Tax History Compared to Growth
Tax History
| Year | Tax Paid | Tax Assessment Tax Assessment Total Assessment is a certain percentage of the fair market value that is determined by local assessors to be the total taxable value of land and additions on the property. | Land | Improvement |
|---|---|---|---|---|
| 2025 | $7,653 | $50,400 | $7,885 | $42,515 |
| 2024 | $7,653 | $45,420 | $8,255 | $37,165 |
| 2023 | $7,626 | $37,549 | $7,659 | $29,890 |
| 2022 | $7,072 | $45,180 | $9,840 | $35,340 |
| 2021 | $7,455 | $38,100 | $9,840 | $28,260 |
| 2020 | $7,124 | $38,640 | $9,840 | $28,800 |
| 2019 | $6,642 | $34,380 | $9,840 | $24,540 |
| 2018 | $6,379 | $31,291 | $9,646 | $21,645 |
| 2017 | $6,018 | $29,520 | $9,840 | $19,680 |
| 2016 | $5,943 | $29,729 | $9,810 | $19,919 |
| 2015 | $5,078 | $28,047 | $8,175 | $19,872 |
| 2014 | $5,078 | $26,460 | $8,220 | $18,240 |
Source: Public Records
Map
Nearby Homes