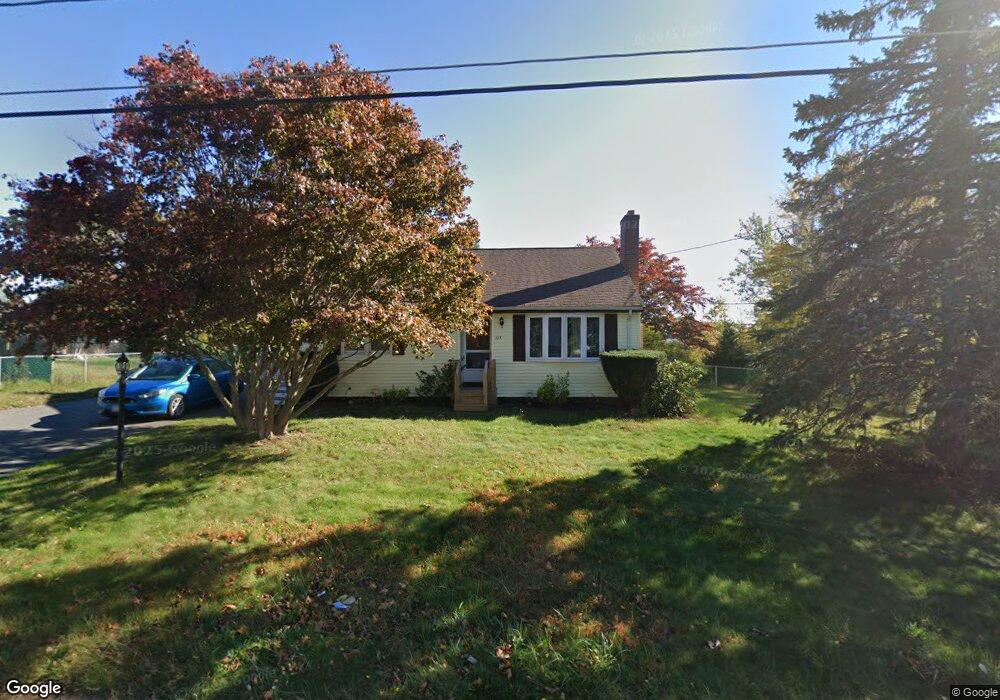
115 Ashfield Dr Brockton, MA 02302
Estimated Value: $501,000 - $561,000
3
Beds
2
Baths
1,366
Sq Ft
$380/Sq Ft
Est. Value
About This Home
This home is located at 115 Ashfield Dr, Brockton, MA 02302 and is currently estimated at $518,892, approximately $379 per square foot. 115 Ashfield Dr is a home located in Plymouth County with nearby schools including Brookfield Elementary School, Mary E. Baker Elementary School, and Downey Elementary School.
Ownership History
Date
Name
Owned For
Owner Type
Purchase Details
Closed on
Sep 28, 2022
Sold by
Lane Marcia A
Bought by
Ram E Cynthia
Current Estimated Value
Purchase Details
Closed on
Apr 27, 2021
Sold by
Ram E Cynthia
Bought by
Lane Marcia A
Purchase Details
Closed on
Dec 13, 2011
Sold by
Ram E C and Gopie Andrea M
Bought by
Ram E C and Gopie Andrea M
Purchase Details
Closed on
Jan 26, 2010
Sold by
Ram Angela S
Bought by
Angela S Ram T
Purchase Details
Closed on
Jul 12, 1991
Sold by
Caswell T
Bought by
Ram Cynthia E
Home Financials for this Owner
Home Financials are based on the most recent Mortgage that was taken out on this home.
Original Mortgage
$79,600
Interest Rate
9.35%
Mortgage Type
Purchase Money Mortgage
Create a Home Valuation Report for This Property
The Home Valuation Report is an in-depth analysis detailing your home's value as well as a comparison with similar homes in the area
Home Values in the Area
Average Home Value in this Area
Purchase History
| Date | Buyer | Sale Price | Title Company |
|---|---|---|---|
| Ram E Cynthia | -- | None Available | |
| Ram E Cynthia | -- | None Available | |
| Lane Marcia A | -- | None Available | |
| Lane Marcia A | -- | None Available | |
| Ram E C | -- | -- | |
| Ram E C | -- | -- | |
| Angela S Ram T | -- | -- | |
| Gopie Ram E | -- | -- | |
| Angela S Ram T S | -- | -- | |
| Ram Cynthia E | $99,500 | -- |
Source: Public Records
Mortgage History
| Date | Status | Borrower | Loan Amount |
|---|---|---|---|
| Previous Owner | Ram Cynthia E | $74,500 | |
| Previous Owner | Ram Cynthia E | $79,600 | |
| Previous Owner | Ram Cynthia E | $75,000 |
Source: Public Records
Tax History Compared to Growth
Tax History
| Year | Tax Paid | Tax Assessment Tax Assessment Total Assessment is a certain percentage of the fair market value that is determined by local assessors to be the total taxable value of land and additions on the property. | Land | Improvement |
|---|---|---|---|---|
| 2025 | $5,411 | $446,800 | $146,500 | $300,300 |
| 2024 | $5,158 | $429,100 | $146,500 | $282,600 |
| 2023 | $4,964 | $382,400 | $111,600 | $270,800 |
| 2022 | $4,558 | $326,300 | $101,500 | $224,800 |
| 2021 | $4,479 | $308,900 | $96,000 | $212,900 |
| 2020 | $4,295 | $283,500 | $91,900 | $191,600 |
| 2019 | $4,121 | $265,200 | $86,300 | $178,900 |
| 2018 | $3,466 | $232,000 | $86,300 | $145,700 |
| 2017 | $3,466 | $215,300 | $86,300 | $129,000 |
| 2016 | $3,531 | $203,400 | $82,300 | $121,100 |
| 2015 | $3,158 | $174,000 | $82,300 | $91,700 |
| 2014 | $3,095 | $170,700 | $82,300 | $88,400 |
Source: Public Records
Map
Nearby Homes