Estimated Value: $368,360 - $534,000
3
Beds
2
Baths
1,600
Sq Ft
$283/Sq Ft
Est. Value
About This Home
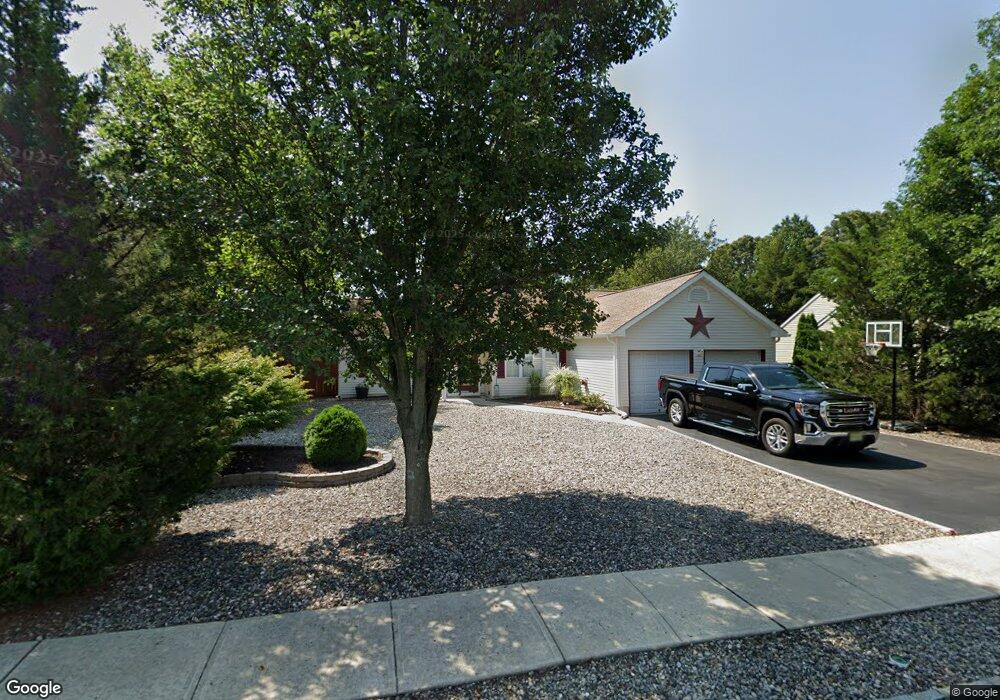
This home is located at 115 Boom Way, Little Egg Harbor Township, NJ 08087 and is currently estimated at $453,590, approximately $283 per square foot. 115 Boom Way is a home located in Ocean County with nearby schools including George J. Mitchell Elementary School, Pinelands Regional Junior High School, and Pinelands Regional High School.
Ownership History
Date
Name
Owned For
Owner Type
Purchase Details
Closed on
Aug 23, 2011
Sold by
The Sarkisian Family Trust and Denison Arlene G
Bought by
Fehring David and Fehring Shana
Current Estimated Value
Home Financials for this Owner
Home Financials are based on the most recent Mortgage that was taken out on this home.
Original Mortgage
$165,150
Outstanding Balance
$114,081
Interest Rate
4.52%
Mortgage Type
New Conventional
Estimated Equity
$339,509
Purchase Details
Closed on
Apr 6, 2010
Sold by
Sarkisian Edward and Sarkisian Grace
Bought by
Sarkisian Family Trust and Denison Arlene G
Purchase Details
Closed on
Oct 6, 1998
Sold by
Arya Properties Lp
Bought by
Sarkisian Edward and Sarkisian Grace
Create a Home Valuation Report for This Property
The Home Valuation Report is an in-depth analysis detailing your home's value as well as a comparison with similar homes in the area
Home Values in the Area
Average Home Value in this Area
Purchase History
| Date | Buyer | Sale Price | Title Company |
|---|---|---|---|
| Fehring David | $183,500 | Surety Title Agency Coastal | |
| Sarkisian Family Trust | -- | None Available | |
| Sarkisian Edward | $110,945 | -- |
Source: Public Records
Mortgage History
| Date | Status | Borrower | Loan Amount |
|---|---|---|---|
| Open | Fehring David | $165,150 |
Source: Public Records
Tax History Compared to Growth
Tax History
| Year | Tax Paid | Tax Assessment Tax Assessment Total Assessment is a certain percentage of the fair market value that is determined by local assessors to be the total taxable value of land and additions on the property. | Land | Improvement |
|---|---|---|---|---|
| 2025 | $5,618 | $189,600 | $59,000 | $130,600 |
| 2024 | $5,383 | $189,600 | $59,000 | $130,600 |
| 2023 | $5,214 | $189,600 | $59,000 | $130,600 |
| 2022 | $5,214 | $189,600 | $59,000 | $130,600 |
| 2021 | $5,091 | $189,600 | $59,000 | $130,600 |
| 2020 | $5,024 | $189,600 | $59,000 | $130,600 |
| 2019 | $4,822 | $189,600 | $59,000 | $130,600 |
| 2018 | $4,547 | $189,600 | $59,000 | $130,600 |
| 2017 | $4,476 | $189,600 | $59,000 | $130,600 |
| 2016 | $4,512 | $189,600 | $59,000 | $130,600 |
| 2015 | $4,567 | $189,600 | $59,000 | $130,600 |
| 2014 | $4,095 | $214,300 | $78,000 | $136,300 |
Source: Public Records
Map
Nearby Homes
- 11 Greenbriar Dr
- 8 Ridgeway Ln
- 19 Plantation Dr
- 20 Colonial Dr
- 31 Daddy Tucker Dr
- 56 Flax Isle Dr
- 67 Flax Isle Dr
- 40 Daddy Tucker Dr
- 13 Pinehurst Dr
- 12 Pinehurst Dr
- 47 Pinehurst Dr
- 19 Waters Edge Dr
- 5 Hunter Dr
- 19 Atlantis Blvd
- 79 Dolphin Rd
- 1 Pinehurst Dr
- 10 Sea Isle Dr
- 131 Holly Ct
- 604 S Green St
- 111 W Holly Ln