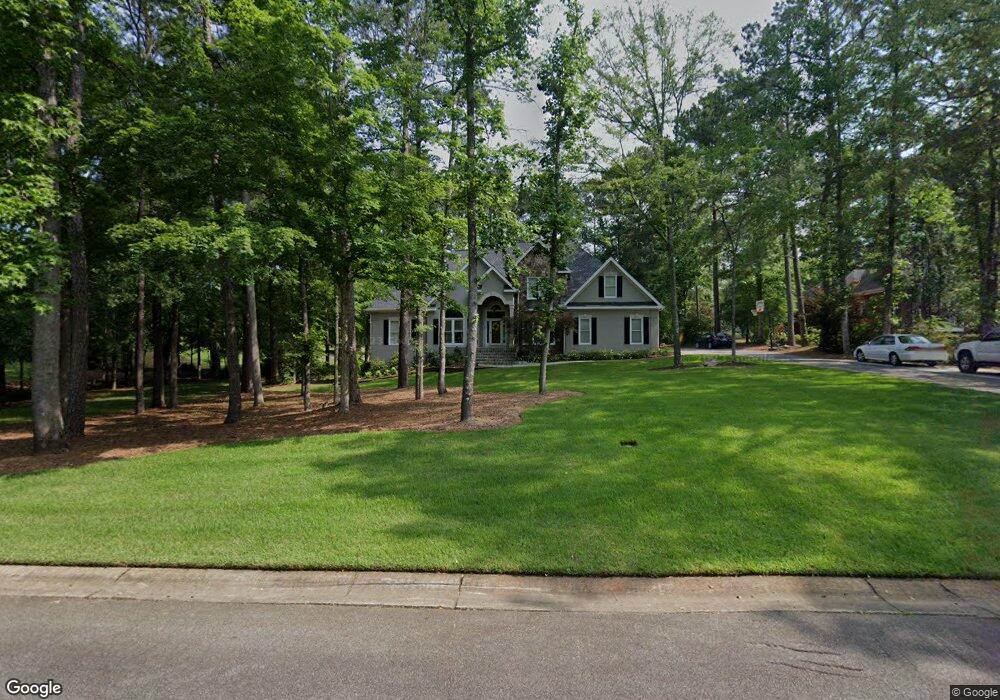
115 Boulder Cove Unit /407G Macon, GA 31220
Barrington Hall NeighborhoodEstimated Value: $404,000 - $455,115
3
Beds
7
Baths
3,971
Sq Ft
$107/Sq Ft
Est. Value
About This Home
This home is located at 115 Boulder Cove Unit /407G, Macon, GA 31220 and is currently estimated at $425,029, approximately $107 per square foot. 115 Boulder Cove Unit /407G is a home located in Bibb County with nearby schools including Carter Elementary School, Howard Middle School, and Howard High School.
Ownership History
Date
Name
Owned For
Owner Type
Purchase Details
Closed on
Sep 26, 2019
Sold by
U S Bank National Association
Bought by
Mid Ga Housing Llc
Current Estimated Value
Purchase Details
Closed on
Dec 8, 2018
Sold by
Bysinger Wallace G and Bysinger Sandra S
Bought by
Us Bank Trust Na
Purchase Details
Closed on
Mar 1, 2007
Sold by
Bysinger Sandra Sue
Bought by
Bysinger Wallace G
Purchase Details
Closed on
Oct 4, 2005
Sold by
Olmer R Thomas
Bought by
Bysinger Wallace G and Bysinger Sandra S
Home Financials for this Owner
Home Financials are based on the most recent Mortgage that was taken out on this home.
Original Mortgage
$325,800
Interest Rate
7.5%
Mortgage Type
Adjustable Rate Mortgage/ARM
Create a Home Valuation Report for This Property
The Home Valuation Report is an in-depth analysis detailing your home's value as well as a comparison with similar homes in the area
Home Values in the Area
Average Home Value in this Area
Purchase History
| Date | Buyer | Sale Price | Title Company |
|---|---|---|---|
| Mid Ga Housing Llc | $210,000 | None Available | |
| Us Bank Trust Na | $332,073 | None Available | |
| Bysinger Wallace G | -- | None Available | |
| Bysinger Wallace G | $362,000 | None Available |
Source: Public Records
Mortgage History
| Date | Status | Borrower | Loan Amount |
|---|---|---|---|
| Previous Owner | Bysinger Wallace G | $325,800 |
Source: Public Records
Tax History Compared to Growth
Tax History
| Year | Tax Paid | Tax Assessment Tax Assessment Total Assessment is a certain percentage of the fair market value that is determined by local assessors to be the total taxable value of land and additions on the property. | Land | Improvement |
|---|---|---|---|---|
| 2025 | $4,136 | $168,302 | $16,000 | $152,302 |
| 2024 | $4,274 | $168,302 | $16,000 | $152,302 |
| 2023 | $3,827 | $150,679 | $16,000 | $134,679 |
| 2022 | $4,830 | $139,498 | $17,850 | $121,648 |
| 2021 | $4,711 | $123,982 | $17,500 | $106,482 |
| 2020 | $3,261 | $123,982 | $17,500 | $106,482 |
| 2019 | $4,536 | $115,871 | $17,500 | $98,371 |
| 2018 | $7,666 | $124,874 | $20,830 | $104,044 |
| 2017 | $4,568 | $121,921 | $20,830 | $101,091 |
| 2016 | $4,545 | $131,376 | $24,505 | $106,871 |
| 2015 | $6,433 | $131,376 | $24,505 | $106,871 |
| 2014 | $6,443 | $131,376 | $24,505 | $106,871 |
Source: Public Records
Map
Nearby Homes
- 119 Stoney Creek Dr
- 122 Stoney Creek Dr
- 176 Hampton Way
- 184 Hampton Way
- 120 Hampton Way Unit LOT 6
- 116 Hampton Way Unit LOT 5
- 100 Colaparchee Plantation Dr
- 167 Barrington Hall Dr
- 513 Litchfield Dr
- 731 Latrobe Way
- 727 Latrobe Way
- 128 Greenview Terrace
- 300 Misty Ridge
- 711 Latrobe Way
- 129 Burchwood Dr
- 133 Princeton Dr
- 204 Princeton Ct
- 327 Ivystone Dr
- 409 Cambridge Ct
- 115 Boulder Cove
- 119 Boulder Cove
- 109 Boulder Cove
- 123 Boulder Cove
- 114 Boulder Cove
- 108 Boulder Cove
- 120 Boulder Cove
- 105 Boulder Cove
- 124 Boulder Cove
- 100 Boulder Cove
- 115 Stoney Creek Dr
- 610 Pineland Place
- 128 Boulder Cove
- 705 Ansley Ct
- 101 Boulder Cove
- 604 Pineland Place
- 131 Boulder Cove
- 117 Stoney Creek Dr
- 0 Stoney Creek Dr Unit 8558507
- 0 Stoney Creek Dr Unit 3063583