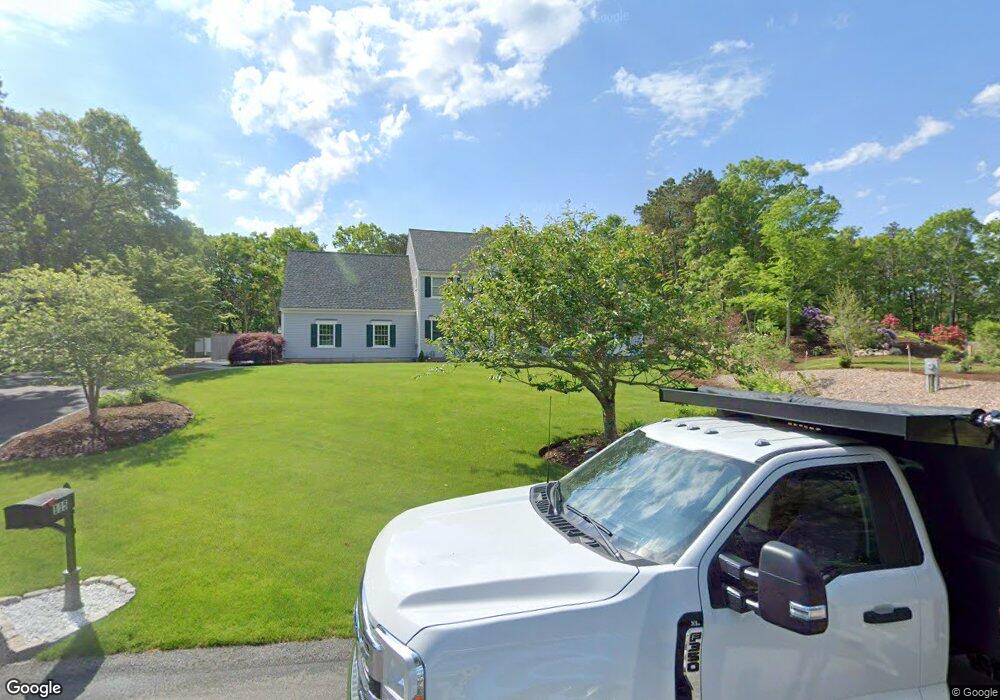
115 Brentwood Dr Yarmouth Port, MA 02675
Barnstable Village NeighborhoodEstimated Value: $1,107,000 - $1,443,000
3
Beds
4
Baths
2,983
Sq Ft
$443/Sq Ft
Est. Value
About This Home
This home is located at 115 Brentwood Dr, Yarmouth Port, MA 02675 and is currently estimated at $1,322,444, approximately $443 per square foot. 115 Brentwood Dr is a home located in Barnstable County with nearby schools including West Barnstable Elementary School, Barnstable United Elementary School, and Barnstable Intermediate School.
Ownership History
Date
Name
Owned For
Owner Type
Purchase Details
Closed on
Sep 14, 2023
Sold by
Hatfield Roger and Hatfield Susan J
Bought by
Desouza Edgar C and Desouza Leticia
Current Estimated Value
Home Financials for this Owner
Home Financials are based on the most recent Mortgage that was taken out on this home.
Original Mortgage
$500,000
Outstanding Balance
$488,314
Interest Rate
6.9%
Mortgage Type
Purchase Money Mortgage
Estimated Equity
$834,130
Purchase Details
Closed on
May 24, 2022
Sold by
Robertson Michelle J
Bought by
Hatfield Roger and Hatfield Susan J
Purchase Details
Closed on
Jul 7, 2020
Sold by
Raggio Anthony D and Raggio My L
Bought by
Robertson Michelle J
Home Financials for this Owner
Home Financials are based on the most recent Mortgage that was taken out on this home.
Original Mortgage
$547,315
Interest Rate
3.1%
Mortgage Type
Purchase Money Mortgage
Create a Home Valuation Report for This Property
The Home Valuation Report is an in-depth analysis detailing your home's value as well as a comparison with similar homes in the area
Home Values in the Area
Average Home Value in this Area
Purchase History
| Date | Buyer | Sale Price | Title Company |
|---|---|---|---|
| Desouza Edgar C | $1,350,000 | None Available | |
| Hatfield Roger | $1,050,000 | None Available | |
| Robertson Michelle J | $685,000 | None Available |
Source: Public Records
Mortgage History
| Date | Status | Borrower | Loan Amount |
|---|---|---|---|
| Open | Desouza Edgar C | $500,000 | |
| Previous Owner | Robertson Michelle J | $547,315 |
Source: Public Records
Tax History Compared to Growth
Tax History
| Year | Tax Paid | Tax Assessment Tax Assessment Total Assessment is a certain percentage of the fair market value that is determined by local assessors to be the total taxable value of land and additions on the property. | Land | Improvement |
|---|---|---|---|---|
| 2025 | $10,024 | $1,084,800 | $204,600 | $880,200 |
| 2024 | $8,537 | $974,600 | $204,600 | $770,000 |
| 2023 | $7,783 | $866,700 | $202,400 | $664,300 |
| 2022 | $7,838 | $702,300 | $144,400 | $557,900 |
| 2021 | $7,671 | $655,100 | $144,400 | $510,700 |
| 2020 | $7,594 | $619,400 | $155,200 | $464,200 |
| 2019 | $7,606 | $622,400 | $155,200 | $467,200 |
| 2018 | $6,465 | $583,900 | $170,300 | $413,600 |
| 2017 | $7,163 | $573,000 | $170,300 | $402,700 |
| 2016 | $7,082 | $574,400 | $171,700 | $402,700 |
| 2015 | $6,487 | $535,700 | $164,400 | $371,300 |
Source: Public Records
Map
Nearby Homes
- 92 Brentwood Ln
- 92 Brentwood Dr
- 44 Iris Ln
- 41 Dromoland Ln
- 65 Oakmont Rd
- 67 Spy Glass Hill Rd
- 83 Sisters Cir
- 83 Sisters Cir
- 81 Desert Sands Ln
- 294 Salt Rock Rd
- 33 Midpine Rd
- 17 Indian Trail
- 30 Indian Trail
- 21 Indian Trail
- 25 Congressional Dr
- 4390 Main St
- 240 Braggs Ln
- 99 Old Hyannis Rd
- 111 Old Hyannis Rd
- 70 Acre Hill Rd
- 115 Brentwood Ln
- 105 Brentwood Dr
- 125 Brentwood Dr
- 125 Brentwood Ln
- 130 Brentwood Dr
- 89 Brentwood Dr
- 140 Brentwood Ln
- 140 Brentwood Dr
- 71 Brentwood Dr
- 76 Brentwood Dr
- 142 Brentwood Ln
- 142 Brentwood Dr
- 139 Brentwood Dr
- 175 Oakmont Rd
- 139 Brentwood
- 139 Brentwood Ln
- 61 Brentwood Dr
- 151 Althea Dr
- 55 Brentwood Ln
- 55 Brentwood Dr