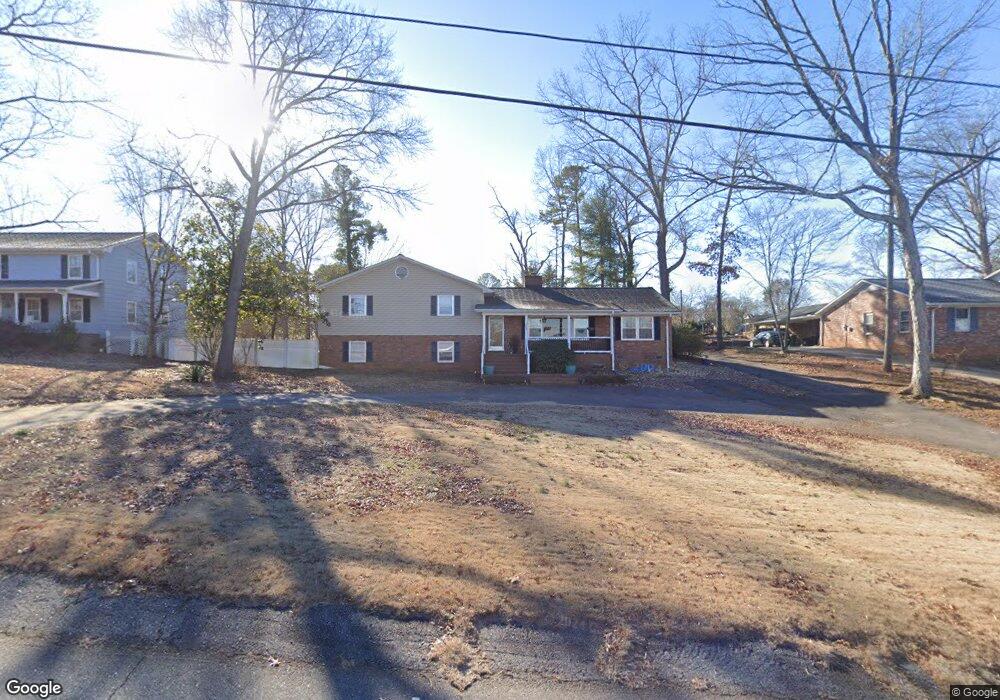
115 Brian Dr Spartanburg, SC 29307
Hillbrook NeighborhoodEstimated Value: $405,210 - $430,000
4
Beds
3
Baths
3,458
Sq Ft
$120/Sq Ft
Est. Value
About This Home
This home is located at 115 Brian Dr, Spartanburg, SC 29307 and is currently estimated at $416,053, approximately $120 per square foot. 115 Brian Dr is a home located in Spartanburg County with nearby schools including Spartanburg High School, Spartanburg Day School, and St. Paul The Apostle Catholic School.
Ownership History
Date
Name
Owned For
Owner Type
Purchase Details
Closed on
Jul 31, 2013
Sold by
Diacon Llc
Bought by
Curry Shell
Current Estimated Value
Home Financials for this Owner
Home Financials are based on the most recent Mortgage that was taken out on this home.
Original Mortgage
$195,000
Interest Rate
6.25%
Mortgage Type
Seller Take Back
Purchase Details
Closed on
Jun 24, 2011
Sold by
Diacon Llc
Bought by
Barber William Chadwick and Deitz Frances Rosalee
Home Financials for this Owner
Home Financials are based on the most recent Mortgage that was taken out on this home.
Original Mortgage
$175,000
Interest Rate
8%
Mortgage Type
Seller Take Back
Purchase Details
Closed on
Nov 2, 2010
Sold by
Heatly David Hudson and Heatly Catherine B
Bought by
Diacon Llc
Purchase Details
Closed on
Jun 13, 2008
Sold by
Heatly Richard C
Bought by
Diacon Llc
Purchase Details
Closed on
Jan 16, 2003
Sold by
Hamilton Sara H
Bought by
Heatly Richard C
Create a Home Valuation Report for This Property
The Home Valuation Report is an in-depth analysis detailing your home's value as well as a comparison with similar homes in the area
Home Values in the Area
Average Home Value in this Area
Purchase History
| Date | Buyer | Sale Price | Title Company |
|---|---|---|---|
| Curry Shell | $205,000 | -- | |
| Barber William Chadwick | $180,000 | -- | |
| Diacon Llc | $1,000 | -- | |
| Diacon Llc | $115,000 | -- | |
| Heatly Richard C | -- | -- |
Source: Public Records
Mortgage History
| Date | Status | Borrower | Loan Amount |
|---|---|---|---|
| Closed | Curry Shell | $195,000 | |
| Closed | Barber William Chadwick | $175,000 |
Source: Public Records
Tax History Compared to Growth
Tax History
| Year | Tax Paid | Tax Assessment Tax Assessment Total Assessment is a certain percentage of the fair market value that is determined by local assessors to be the total taxable value of land and additions on the property. | Land | Improvement |
|---|---|---|---|---|
| 2025 | $2,004 | $6,570 | $1,137 | $5,433 |
| 2024 | $2,004 | $6,570 | $1,137 | $5,433 |
| 2023 | $2,004 | $6,570 | $1,137 | $5,433 |
| 2022 | $1,705 | $5,713 | $1,190 | $4,523 |
| 2021 | $1,705 | $5,713 | $1,190 | $4,523 |
| 2020 | $1,575 | $5,276 | $1,400 | $3,876 |
| 2019 | $1,575 | $5,276 | $1,400 | $3,876 |
| 2018 | $1,575 | $5,276 | $1,400 | $3,876 |
| 2017 | $1,511 | $4,968 | $1,400 | $3,568 |
| 2016 | $1,511 | $4,968 | $1,400 | $3,568 |
| 2015 | $1,436 | $4,920 | $1,400 | $3,520 |
| 2014 | $1,431 | $4,920 | $1,400 | $3,520 |
Source: Public Records
Map
Nearby Homes
- 5 Wisteria Ct
- 251 Winfield Dr
- 23 Woodbine Ct
- 404 Mockingbird Ln
- 294 Hollis Dr
- 0 Heathwood Dr
- 416 Ransdell Dr
- 21 Summercreek Dr Unit 4C
- 10 Summercreek Dr Unit 5D
- 103 Heritage Lake Forest Dr
- 265 Hollis Dr
- 31 Summercreek Dr
- 34 Summercreek Dr
- 432 Ransdell Dr
- 47 Summercreek Dr
- 427 Ransdell Dr
- 254 Hollis Dr
- 120 Fernridge Dr
- 104 Sunline Place
- 151 Fernridge Dr