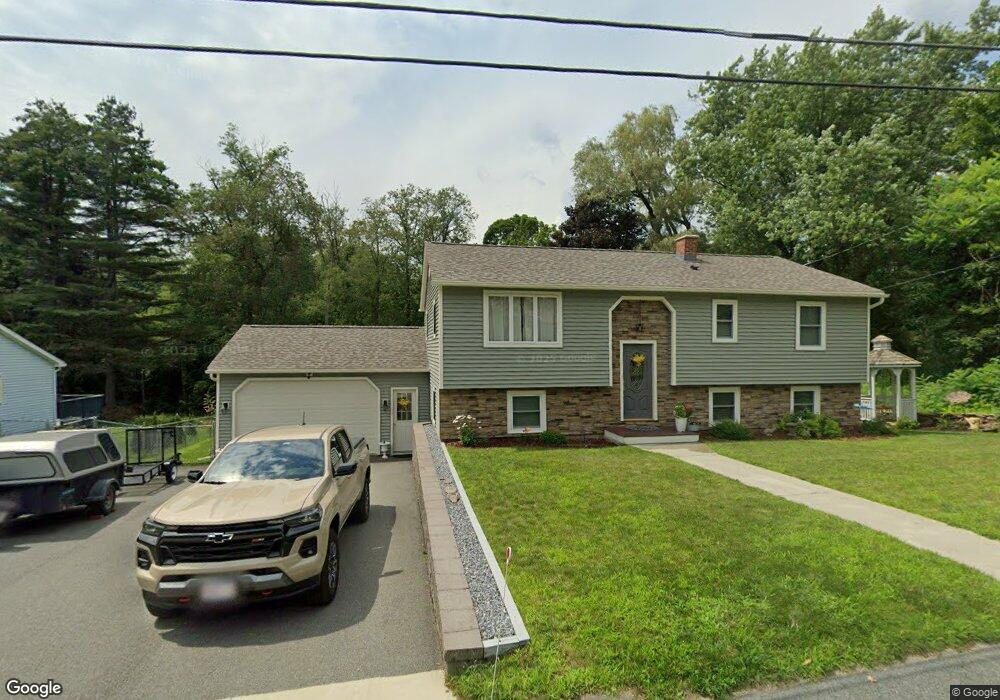
115 Bromback St Pittsfield, MA 01201
Estimated Value: $292,000 - $472,000
3
Beds
2
Baths
2,200
Sq Ft
$157/Sq Ft
Est. Value
About This Home
This home is located at 115 Bromback St, Pittsfield, MA 01201 and is currently estimated at $345,542, approximately $157 per square foot. 115 Bromback St is a home located in Berkshire County with nearby schools including Robert T. Capeless Elementary School, John T. Reid Middle School, and Taconic High School.
Ownership History
Date
Name
Owned For
Owner Type
Purchase Details
Closed on
Jun 4, 2024
Sold by
Vincent Brian R and Vincent Patricia A
Bought by
Olson Robin L
Current Estimated Value
Purchase Details
Closed on
Mar 3, 1972
Bought by
Vincent Brian R and Vincent Patricia A
Create a Home Valuation Report for This Property
The Home Valuation Report is an in-depth analysis detailing your home's value as well as a comparison with similar homes in the area
Home Values in the Area
Average Home Value in this Area
Purchase History
| Date | Buyer | Sale Price | Title Company |
|---|---|---|---|
| Olson Robin L | -- | None Available | |
| Olson Robin L | -- | None Available | |
| Olson Robin L | -- | None Available | |
| Vincent Brian R | -- | -- |
Source: Public Records
Mortgage History
| Date | Status | Borrower | Loan Amount |
|---|---|---|---|
| Previous Owner | Vincent Brian R | $15,000 | |
| Previous Owner | Vincent Brian R | $30,000 |
Source: Public Records
Tax History
| Year | Tax Paid | Tax Assessment Tax Assessment Total Assessment is a certain percentage of the fair market value that is determined by local assessors to be the total taxable value of land and additions on the property. | Land | Improvement |
|---|---|---|---|---|
| 2025 | $4,948 | $275,800 | $63,700 | $212,100 |
| 2024 | $4,507 | $244,300 | $63,700 | $180,600 |
| 2023 | $4,089 | $223,200 | $58,800 | $164,400 |
| 2022 | $3,740 | $201,500 | $56,400 | $145,100 |
| 2021 | $3,613 | $187,700 | $56,400 | $131,300 |
| 2020 | $3,644 | $184,900 | $56,400 | $128,500 |
| 2019 | $3,400 | $175,100 | $51,000 | $124,100 |
| 2018 | $3,442 | $172,000 | $51,000 | $121,000 |
| 2017 | $3,251 | $165,600 | $49,000 | $116,600 |
| 2016 | $3,139 | $167,300 | $49,000 | $118,300 |
| 2015 | $3,021 | $167,300 | $49,000 | $118,300 |
Source: Public Records
Map
Nearby Homes
- 144 Brombach St
- 561 Pecks Rd
- 119 Orlando Ave
- 14 Highland Ave
- 0 Oakhurst Ave
- 15 Orlando Ave
- 1 Lakewood Dr
- 30 Lakewood Dr
- 55 Newton Ave
- 36 Beacon Ave
- 0 Beacon Ave
- 2 Lakewood Cir
- 30 Pinehurst Ave
- 140 Hancock Rd
- 17 Fieldstone Dr
- 14 Sunrise Cir
- 25 Calumet St
- 11 Opeechee St
- 16 Opeechee St
- 15 Cherry Hill Dr
Your Personal Tour Guide
Ask me questions while you tour the home.