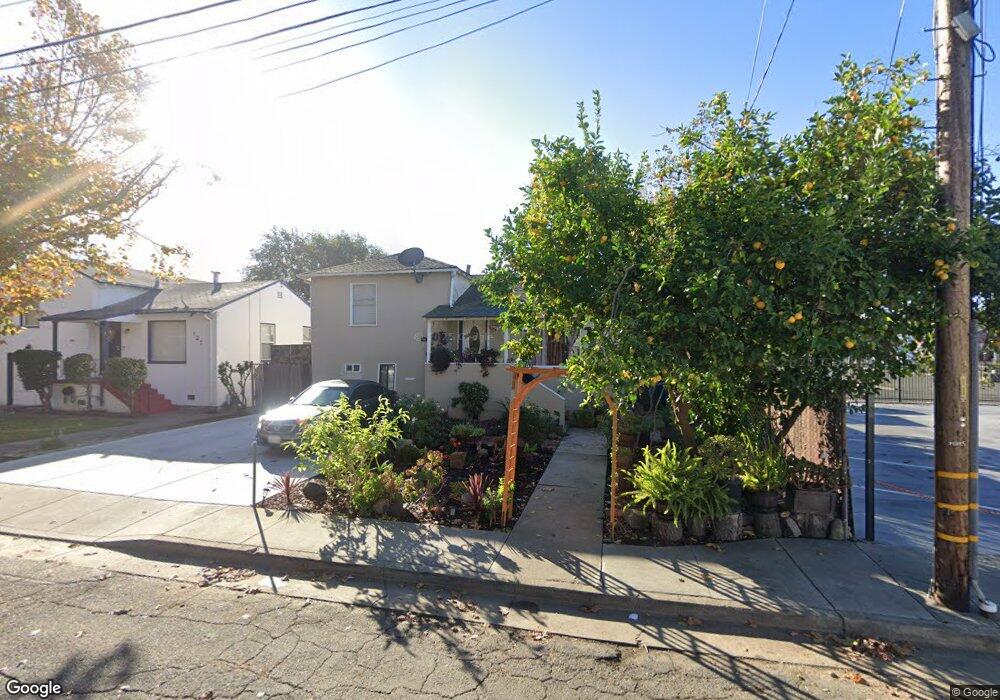
115 Byron St Vallejo, CA 94590
Vallejo Heights NeighborhoodEstimated Value: $481,000 - $628,000
3
Beds
2
Baths
1,450
Sq Ft
$362/Sq Ft
Est. Value
About This Home
This home is located at 115 Byron St, Vallejo, CA 94590 and is currently estimated at $524,483, approximately $361 per square foot. 115 Byron St is a home located in Solano County with nearby schools including Highland Elementary, Vallejo High School, and Caliber: ChangeMakers Academy.
Ownership History
Date
Name
Owned For
Owner Type
Purchase Details
Closed on
Jun 4, 2001
Sold by
Mata James and Mata Janet
Bought by
Cota Manuel D and Kellogg Smith Julie H
Current Estimated Value
Home Financials for this Owner
Home Financials are based on the most recent Mortgage that was taken out on this home.
Original Mortgage
$158,560
Outstanding Balance
$60,443
Interest Rate
7.15%
Estimated Equity
$464,040
Create a Home Valuation Report for This Property
The Home Valuation Report is an in-depth analysis detailing your home's value as well as a comparison with similar homes in the area
Home Values in the Area
Average Home Value in this Area
Purchase History
| Date | Buyer | Sale Price | Title Company |
|---|---|---|---|
| Cota Manuel D | $172,000 | Frontier Title Company |
Source: Public Records
Mortgage History
| Date | Status | Borrower | Loan Amount |
|---|---|---|---|
| Open | Cota Manuel D | $158,560 | |
| Closed | Cota Manuel D | $10,000 |
Source: Public Records
Tax History
| Year | Tax Paid | Tax Assessment Tax Assessment Total Assessment is a certain percentage of the fair market value that is determined by local assessors to be the total taxable value of land and additions on the property. | Land | Improvement |
|---|---|---|---|---|
| 2025 | $4,953 | $259,168 | $52,734 | $206,434 |
| 2024 | $4,953 | $254,087 | $51,700 | $202,387 |
| 2023 | $3,763 | $249,106 | $50,687 | $198,419 |
| 2022 | $4,492 | $244,223 | $49,695 | $194,528 |
| 2021 | $4,391 | $239,435 | $48,721 | $190,714 |
| 2020 | $4,251 | $236,981 | $48,222 | $188,759 |
| 2019 | $3,801 | $232,335 | $47,277 | $185,058 |
| 2018 | $4,097 | $227,780 | $46,350 | $181,430 |
| 2017 | $4,880 | $223,315 | $45,442 | $177,873 |
| 2016 | $4,056 | $218,937 | $44,551 | $174,386 |
| 2015 | $2,986 | $195,000 | $33,000 | $162,000 |
| 2014 | $2,622 | $163,000 | $28,000 | $135,000 |
Source: Public Records
Map
Nearby Homes
- 900 Alameda St
- 1131 Tennessee St
- 1038 Alabama St
- 327 Arkansas St
- 325 Arkansas St
- 1158 Louisiana St
- 125 Broadway St
- 1208 Amador St
- 939 Ohio St
- 1314 Ohio St
- 1322 Alabama St
- 918 Alameda St
- 844 Kentucky St
- 1322 Sutter St
- 215 Hampshire St
- 17 Hanns Ave
- 1208 Florida St
- 729 Ohio St
- 2328 Napa St
- 726 Monterey St
Your Personal Tour Guide
Ask me questions while you tour the home.