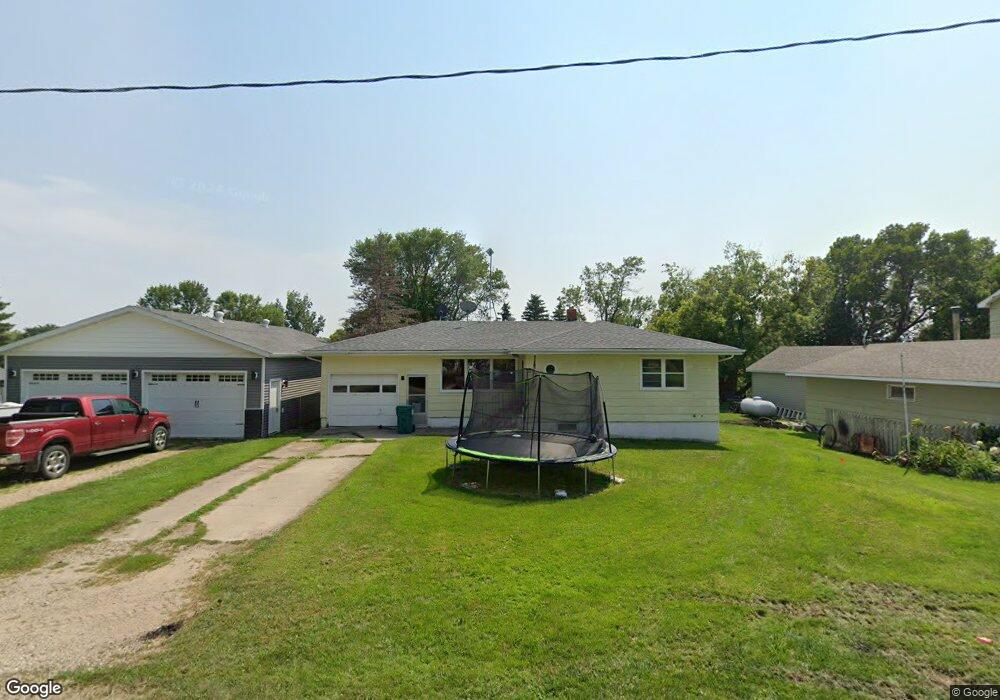
115 Cady St Dwight, ND 58075
Estimated Value: $207,000 - $301,000
2
Beds
2
Baths
2,154
Sq Ft
$110/Sq Ft
Est. Value
About This Home
This home is located at 115 Cady St, Dwight, ND 58075 and is currently estimated at $236,992, approximately $110 per square foot. 115 Cady St is a home located in Richland County with nearby schools including Zimmerman Elementary School, Wahpeton Elementary School, and Wahpeton Middle School.
Ownership History
Date
Name
Owned For
Owner Type
Purchase Details
Closed on
May 10, 2021
Sold by
Griffin Nathan A and Griffin Alicia
Bought by
Shaw Ivan L
Current Estimated Value
Home Financials for this Owner
Home Financials are based on the most recent Mortgage that was taken out on this home.
Original Mortgage
$177,171
Outstanding Balance
$160,561
Interest Rate
3.1%
Mortgage Type
New Conventional
Estimated Equity
$76,431
Purchase Details
Closed on
Mar 23, 2017
Sold by
Barnhardt Steven W
Bought by
Klosterman Shane J
Home Financials for this Owner
Home Financials are based on the most recent Mortgage that was taken out on this home.
Original Mortgage
$46,800
Interest Rate
4.17%
Mortgage Type
New Conventional
Purchase Details
Closed on
Jul 27, 2016
Sold by
Griffin Wendy and Griffin Vaughan
Bought by
Griffin Nathan A
Home Financials for this Owner
Home Financials are based on the most recent Mortgage that was taken out on this home.
Original Mortgage
$32,600
Interest Rate
3.54%
Mortgage Type
VA
Create a Home Valuation Report for This Property
The Home Valuation Report is an in-depth analysis detailing your home's value as well as a comparison with similar homes in the area
Purchase History
| Date | Buyer | Sale Price | Title Company |
|---|---|---|---|
| Shaw Ivan L | $175,400 | Plains Title Llc | |
| Klosterman Shane J | $58,500 | Innovative Abstract & Title | |
| Griffin Nathan A | $32,600 | Fm Title Company |
Source: Public Records
Mortgage History
| Date | Status | Borrower | Loan Amount |
|---|---|---|---|
| Open | Shaw Ivan L | $177,171 | |
| Previous Owner | Klosterman Shane J | $46,800 | |
| Previous Owner | Griffin Nathan A | $32,600 |
Source: Public Records
Tax History
| Year | Tax Paid | Tax Assessment Tax Assessment Total Assessment is a certain percentage of the fair market value that is determined by local assessors to be the total taxable value of land and additions on the property. | Land | Improvement |
|---|---|---|---|---|
| 2024 | $2,542 | $85,300 | $1,350 | $83,950 |
| 2023 | $2,611 | $86,650 | $1,350 | $85,300 |
| 2022 | $2,428 | $79,350 | $700 | $78,650 |
| 2021 | $1,419 | $62,900 | $700 | $62,200 |
| 2020 | $226 | $42,300 | $600 | $41,700 |
| 2019 | $1,369 | $42,300 | $600 | $41,700 |
| 2018 | $761 | $28,150 | $450 | $27,700 |
| 2017 | $736 | $25,650 | $400 | $25,250 |
| 2016 | $558 | $25,650 | $400 | $25,250 |
| 2015 | -- | $2,309 | $0 | $0 |
| 2014 | -- | $2,309 | $0 | $0 |
| 2013 | -- | $1,611 | $0 | $0 |
Source: Public Records
Map
Nearby Homes
- 00 75th St SE
- 0 75th St SE Unit NST7007304
- 17760 78th St SE
- 1837 19th St N
- 1843 19th St N
- 1851 19th St N
- 1849 19th St N
- 7953 180th Ave SE
- 1550 14th Ave N
- 1407 15th St N
- 1440 15th St N
- 1448 13th St N
- 1894 19th Ave
- 1874 19th Ave
- 1883 19th Ave
- 1888 19th Ave
- 1908 19th Ave
- 1880 19th Ave
- 1902 19th Ave
- 1770 19th Ave
Your Personal Tour Guide
Ask me questions while you tour the home.