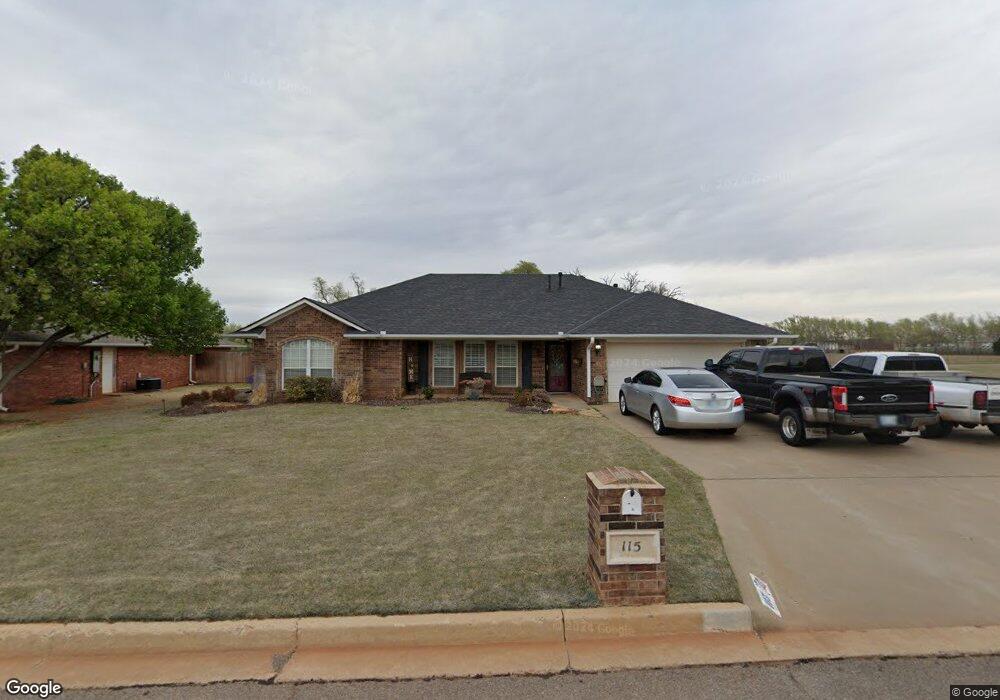
115 Calhoon St Elk City, OK 73644
Estimated Value: $231,000 - $265,000
3
Beds
2
Baths
1,717
Sq Ft
$144/Sq Ft
Est. Value
About This Home
This home is located at 115 Calhoon St, Elk City, OK 73644 and is currently estimated at $247,250, approximately $144 per square foot. 115 Calhoon St is a home located in Beckham County with nearby schools including Elk City Elementary School, Elk City IES, and Elk City Middle School.
Ownership History
Date
Name
Owned For
Owner Type
Purchase Details
Closed on
Aug 4, 2023
Sold by
Jameson Rance Allen
Bought by
Jameson Theresa Jewel
Current Estimated Value
Purchase Details
Closed on
Jul 28, 2009
Sold by
Maddox Danny and Maddox Krissa
Bought by
Jameson Rance and Jameson Theresa
Home Financials for this Owner
Home Financials are based on the most recent Mortgage that was taken out on this home.
Original Mortgage
$130,000
Interest Rate
6%
Mortgage Type
New Conventional
Purchase Details
Closed on
Jul 3, 2008
Sold by
Morris Mark and Morris Beeky
Bought by
Maddox Danny and Maddox Karissa
Purchase Details
Closed on
Apr 22, 2002
Sold by
Tamarack
Bought by
Morris
Purchase Details
Closed on
Jun 18, 2001
Sold by
Sutherland
Bought by
Tamarack
Purchase Details
Closed on
Mar 9, 1994
Sold by
Perano
Bought by
Sutherland
Create a Home Valuation Report for This Property
The Home Valuation Report is an in-depth analysis detailing your home's value as well as a comparison with similar homes in the area
Home Values in the Area
Average Home Value in this Area
Purchase History
| Date | Buyer | Sale Price | Title Company |
|---|---|---|---|
| Jameson Theresa Jewel | -- | None Listed On Document | |
| Jameson Rance | $180,000 | None Available | |
| Maddox Danny | $180,000 | None Available | |
| Morris | $94,200 | -- | |
| Tamarack | $4,000 | -- | |
| Sutherland | $3,000 | -- |
Source: Public Records
Mortgage History
| Date | Status | Borrower | Loan Amount |
|---|---|---|---|
| Previous Owner | Jameson Rance | $130,000 |
Source: Public Records
Tax History Compared to Growth
Tax History
| Year | Tax Paid | Tax Assessment Tax Assessment Total Assessment is a certain percentage of the fair market value that is determined by local assessors to be the total taxable value of land and additions on the property. | Land | Improvement |
|---|---|---|---|---|
| 2024 | $1,856 | $21,017 | $1,200 | $19,817 |
| 2023 | $1,842 | $20,860 | $1,200 | $19,660 |
| 2022 | $1,701 | $20,252 | $1,200 | $19,052 |
| 2021 | $1,647 | $19,662 | $1,368 | $18,294 |
| 2020 | $1,648 | $19,662 | $1,368 | $18,294 |
| 2019 | $1,633 | $19,662 | $1,368 | $18,294 |
| 2018 | $1,649 | $19,662 | $1,368 | $18,294 |
| 2017 | $1,645 | $19,641 | $1,368 | $18,273 |
| 2016 | $1,540 | $19,069 | $1,368 | $17,701 |
| 2015 | $1,238 | $18,513 | $1,368 | $17,145 |
| 2014 | $1,200 | $17,974 | $1,368 | $16,606 |
Source: Public Records
Map
Nearby Homes
- 131 E Bonita Dr
- 101 Maple St
- 151 Calhoon St
- 113115 Hosanna Dr
- 152 Calhoon St
- 207 Magnolia Ave
- 206 Magnolia Ave
- 0 N Lester St
- 206 Cypress Ave
- 0 Airport Industrial
- 517 N Booth Ave
- 515 N Booth Ave
- 618 N Van Buren Ave
- 510 N Jackson Ave
- 0 Unit 1170567
- 117 Shell Blvd
- 111 Allee Dr
- 424 N Madison Ave
- 1101 Colorado Ave
- 00 N 00 Main St
- 117 Calhoon St
- 119 Calhoon St
- 114 Calhoon St
- 112 Calhoon St
- 110 Calhoon St
- 121 Calhoon St
- 120 Calhoon St
- 108 Calhoon St
- 123 Calhoon St
- 117 E Bonita Dr
- 111 E Bonita Dr
- 106 Calhoon St
- 121 E Bonita Dr
- 125 Calhoon St
- 109 E Bonita Dr
- 104 Calhoon St
- 107 E Bonita Dr
- 123 E Bonita Dr
- 127 Calhoon St
- 116 E Bonita Dr