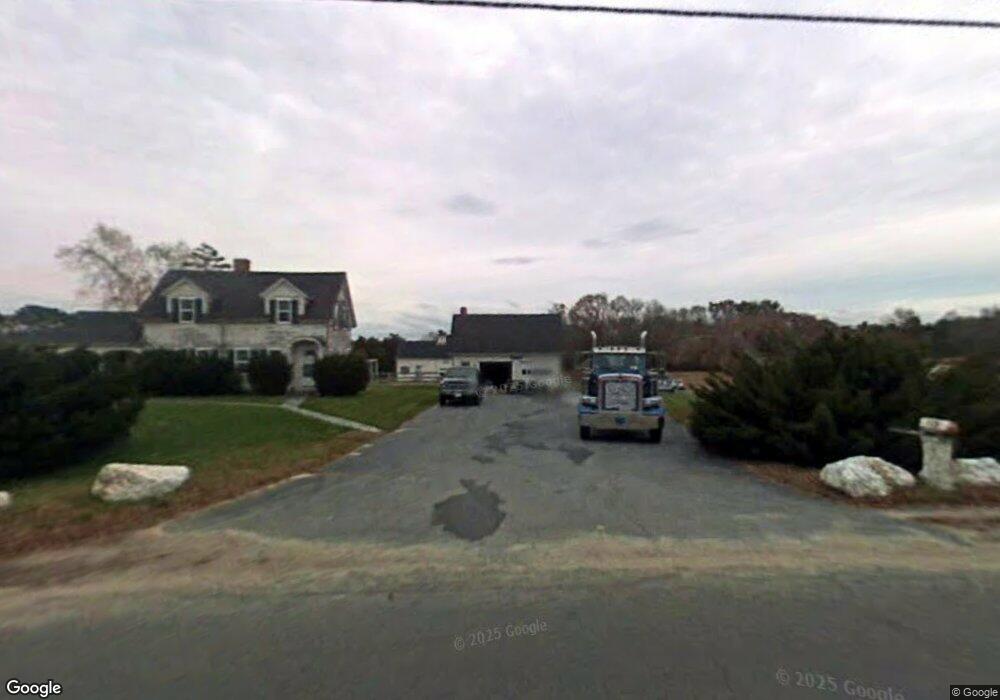
115 Chace Rd East Freetown, MA 02717
Estimated Value: $427,941
2
Beds
2
Baths
1,390
Sq Ft
$308/Sq Ft
Est. Value
About This Home
This home is located at 115 Chace Rd, East Freetown, MA 02717 and is currently estimated at $427,941, approximately $307 per square foot. 115 Chace Rd is a home located in Bristol County with nearby schools including Freetown Elementary School, George R Austin Intermediate School, and Freetown-Lakeville Middle School.
Ownership History
Date
Name
Owned For
Owner Type
Purchase Details
Closed on
Dec 26, 1990
Sold by
Clarence H Est Clark
Bought by
Rosofsky Mark S
Current Estimated Value
Home Financials for this Owner
Home Financials are based on the most recent Mortgage that was taken out on this home.
Original Mortgage
$100,000
Interest Rate
9.96%
Mortgage Type
Commercial
Create a Home Valuation Report for This Property
The Home Valuation Report is an in-depth analysis detailing your home's value as well as a comparison with similar homes in the area
Home Values in the Area
Average Home Value in this Area
Purchase History
| Date | Buyer | Sale Price | Title Company |
|---|---|---|---|
| Rosofsky Mark S | $100,000 | -- | |
| Rosofsky Mark S | $100,000 | -- |
Source: Public Records
Mortgage History
| Date | Status | Borrower | Loan Amount |
|---|---|---|---|
| Closed | Rosofsky Mark S | $77,000 | |
| Closed | Rosofsky Mark S | $100,000 |
Source: Public Records
Tax History Compared to Growth
Tax History
| Year | Tax Paid | Tax Assessment Tax Assessment Total Assessment is a certain percentage of the fair market value that is determined by local assessors to be the total taxable value of land and additions on the property. | Land | Improvement |
|---|---|---|---|---|
| 2025 | -- | $417,000 | $212,200 | $204,800 |
| 2024 | -- | $393,800 | $200,200 | $193,600 |
| 2023 | $0 | $367,800 | $180,300 | $187,500 |
| 2022 | $0 | $339,600 | $152,600 | $187,000 |
| 2021 | $0 | $313,900 | $138,700 | $175,200 |
| 2020 | $0 | $301,700 | $133,300 | $168,400 |
| 2019 | $0 | $279,100 | $126,900 | $152,200 |
| 2018 | $0 | $261,000 | $126,900 | $134,100 |
| 2017 | $0 | $255,700 | $126,900 | $128,800 |
| 2016 | -- | $248,300 | $123,200 | $125,100 |
| 2015 | -- | $246,300 | $123,200 | $123,100 |
| 2014 | -- | $242,000 | $120,800 | $121,200 |
Source: Public Records
Map
Nearby Homes
- 144 Chace Rd
- 0 Costa Dr
- 195 Slab Bridge Rd
- 24 Bells Brook Rd
- 599 Quanapoag Rd
- 150 Quanapoag Rd
- 9 Paul Ave
- Lot 2/3 Quanapoag Rd
- 4597 Acushnet Ave
- 1475 Braley Rd Unit 17
- 13 Luscomb Ln
- 16 Swallow St
- 7 Great Cedar Crossing
- 5 Freetown St
- 1069 Cherokee St
- 319 Northwest St
- 15 Morrison Way
- 269 Middleboro Rd
- 34 Poplar Rd
- 210 Heritage Dr