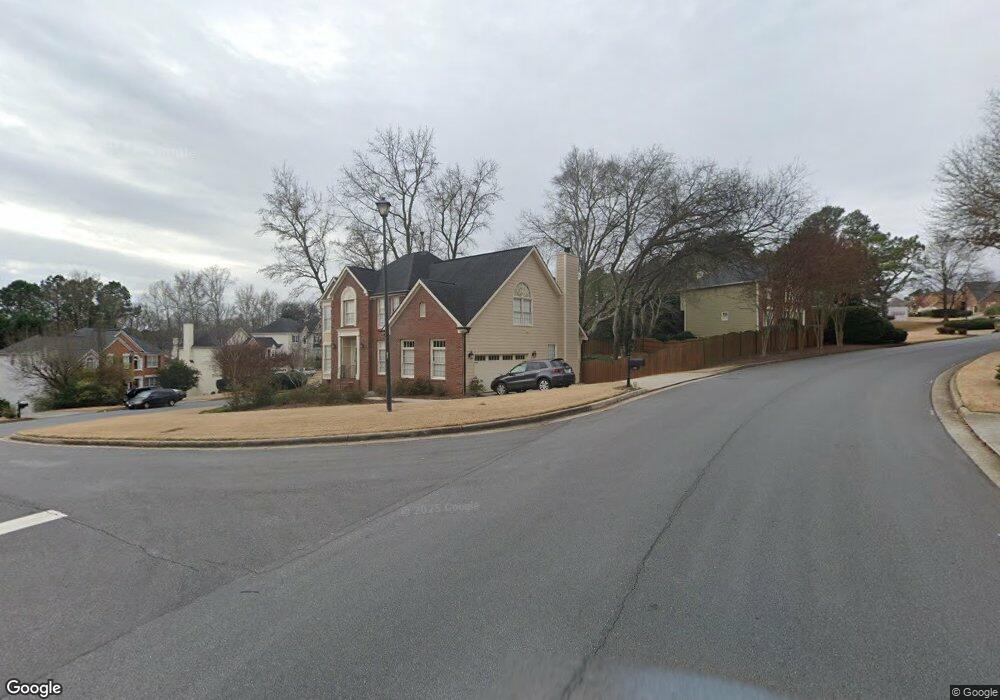
115 Chandon Ct Unit 3 Duluth, GA 30097
Estimated Value: $665,000 - $712,000
4
Beds
3
Baths
2,990
Sq Ft
$232/Sq Ft
Est. Value
About This Home
This home is located at 115 Chandon Ct Unit 3, Duluth, GA 30097 and is currently estimated at $694,011, approximately $232 per square foot. 115 Chandon Ct Unit 3 is a home located in Fulton County with nearby schools including Shakerag Elementary School, River Trail Middle School, and Northview High School.
Ownership History
Date
Name
Owned For
Owner Type
Purchase Details
Closed on
May 28, 2002
Sold by
Horio Tatsuya
Bought by
Blank Ann M
Current Estimated Value
Home Financials for this Owner
Home Financials are based on the most recent Mortgage that was taken out on this home.
Original Mortgage
$196,000
Outstanding Balance
$82,639
Interest Rate
6.77%
Mortgage Type
New Conventional
Estimated Equity
$611,372
Purchase Details
Closed on
Oct 26, 1994
Sold by
Mckenzie Scott W Marie T
Bought by
Horio Tatsuya
Home Financials for this Owner
Home Financials are based on the most recent Mortgage that was taken out on this home.
Original Mortgage
$163,100
Interest Rate
8%
Purchase Details
Closed on
Aug 25, 1993
Sold by
Peachtree Residential Props Inc
Bought by
Mckenzie Scott W
Home Financials for this Owner
Home Financials are based on the most recent Mortgage that was taken out on this home.
Original Mortgage
$158,300
Interest Rate
3.75%
Create a Home Valuation Report for This Property
The Home Valuation Report is an in-depth analysis detailing your home's value as well as a comparison with similar homes in the area
Purchase History
| Date | Buyer | Sale Price | Title Company |
|---|---|---|---|
| Blank Ann M | $245,000 | -- | |
| Horio Tatsuya | $203,900 | -- | |
| Mckenzie Scott W | $197,900 | -- |
Source: Public Records
Mortgage History
| Date | Status | Borrower | Loan Amount |
|---|---|---|---|
| Open | Blank Ann M | $196,000 | |
| Previous Owner | Horio Tatsuya | $163,100 | |
| Previous Owner | Mckenzie Scott W | $158,300 |
Source: Public Records
Tax History
| Year | Tax Paid | Tax Assessment Tax Assessment Total Assessment is a certain percentage of the fair market value that is determined by local assessors to be the total taxable value of land and additions on the property. | Land | Improvement |
|---|---|---|---|---|
| 2025 | $4,197 | $254,440 | $69,920 | $184,520 |
| 2023 | $7,096 | $251,400 | $54,480 | $196,920 |
| 2022 | $4,029 | $198,920 | $40,080 | $158,840 |
| 2021 | $3,972 | $153,400 | $44,600 | $108,800 |
| 2020 | $4,004 | $164,000 | $53,680 | $110,320 |
| 2019 | $497 | $148,200 | $26,400 | $121,800 |
| 2018 | $4,054 | $144,760 | $25,800 | $118,960 |
| 2017 | $3,945 | $133,040 | $25,000 | $108,040 |
| 2016 | $3,860 | $133,040 | $25,000 | $108,040 |
| 2015 | $3,902 | $133,040 | $25,000 | $108,040 |
| 2014 | $3,254 | $105,320 | $19,800 | $85,520 |
Source: Public Records
Map
Nearby Homes
- 7110 Amberleigh Way
- 120 Croftwood Ct
- 347 Wiman Park Ln
- 11165 Olbrich Trail
- 919 Olmsted Ln
- 1294 Cauley Creek Overlook
- 7067 Walham Grove
- 7405 Ledgewood Way
- 7670 Bellemont Ridge
- 11192 Brookhavenclub Dr
- 6210 Bellmoore Park Ln
- 4196 Polly Taylor Rd
- 845 Saint Marks Walk
- 6014 Brookhaven Cir
- 8150 Prestwick Cir
- 11320 Crestview Terrace
- 11395 Easthaven Place
- 12095 Cameron Dr
- 6578 Creekview Cir
- 7809 Laurel Crest Dr
- 105 Chandon Ct
- 125 Chandon Ct
- 7195 Devonhall Way
- 130 Chandon Ct Unit 3
- 120 Chandon Ct Unit 3
- 7185 Devonhall Way
- 140 Chandon Ct Unit 3
- 135 Chandon Ct Unit 3
- 0 Chandon Ct Unit 5083286
- 110 Chandon Ct Unit 3
- 7175 Devonhall Way Unit 3
- 100 Chandon Ct
- 145 Chandon Ct
- 150 Chandon Ct
- 7230 Devonhall Way Unit 2
- 7270 Amberleigh Way
- 7235 Devonhall Way Unit 3
- 160 Chandon Ct
- 7280 Amberleigh Way
- 7260 Amberleigh Way
Your Personal Tour Guide
Ask me questions while you tour the home.