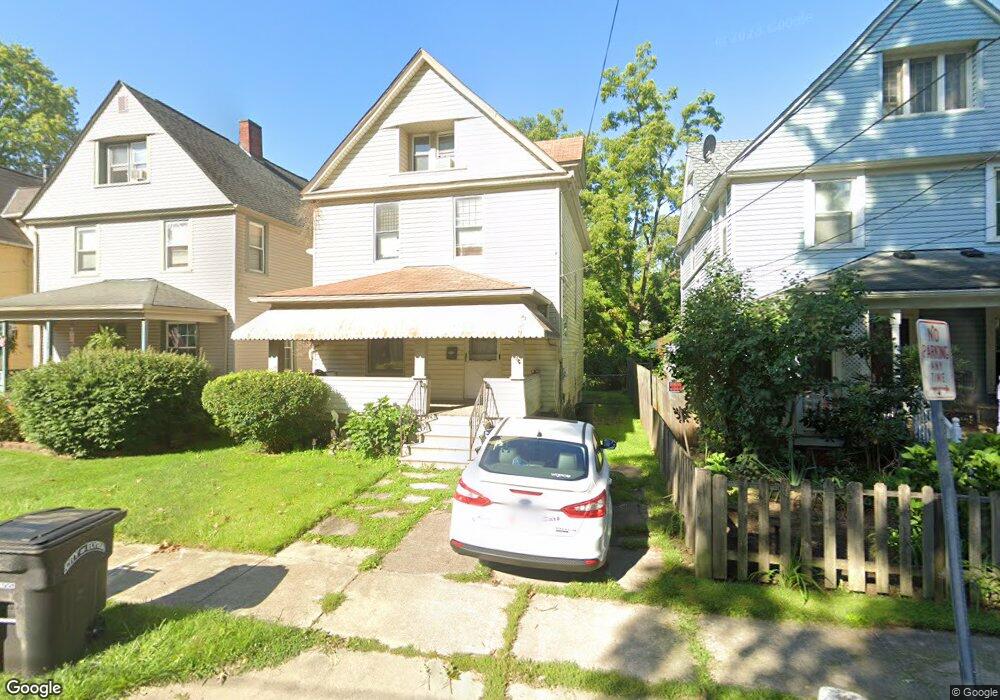
115 Charles Ct Elyria, OH 44035
Estimated Value: $125,363 - $150,000
3
Beds
1
Bath
1,454
Sq Ft
$92/Sq Ft
Est. Value
About This Home
This home is located at 115 Charles Ct, Elyria, OH 44035 and is currently estimated at $133,091, approximately $91 per square foot. 115 Charles Ct is a home located in Lorain County with nearby schools including Eastern Heights Middle School, Elyria High School, and Constellation Schools: Elyria Community Elementary.
Ownership History
Date
Name
Owned For
Owner Type
Purchase Details
Closed on
May 13, 2005
Sold by
Pack Carol J and Pack Virgil
Bought by
Gardner Carrie L
Current Estimated Value
Home Financials for this Owner
Home Financials are based on the most recent Mortgage that was taken out on this home.
Original Mortgage
$75,000
Outstanding Balance
$42,866
Interest Rate
7.37%
Mortgage Type
Fannie Mae Freddie Mac
Estimated Equity
$90,225
Purchase Details
Closed on
Feb 23, 2000
Sold by
Bogle Daisy B
Bought by
Rose Carol J
Home Financials for this Owner
Home Financials are based on the most recent Mortgage that was taken out on this home.
Original Mortgage
$41,922
Interest Rate
8.21%
Mortgage Type
FHA
Purchase Details
Closed on
Mar 27, 1998
Sold by
Estate Of Everett L Bogle
Bought by
Bogle Daisy B
Create a Home Valuation Report for This Property
The Home Valuation Report is an in-depth analysis detailing your home's value as well as a comparison with similar homes in the area
Home Values in the Area
Average Home Value in this Area
Purchase History
| Date | Buyer | Sale Price | Title Company |
|---|---|---|---|
| Gardner Carrie L | $75,000 | First American Title | |
| Rose Carol J | $55,000 | Midland Title | |
| Bogle Daisy B | -- | -- |
Source: Public Records
Mortgage History
| Date | Status | Borrower | Loan Amount |
|---|---|---|---|
| Open | Gardner Carrie L | $75,000 | |
| Previous Owner | Rose Carol J | $41,922 |
Source: Public Records
Tax History
| Year | Tax Paid | Tax Assessment Tax Assessment Total Assessment is a certain percentage of the fair market value that is determined by local assessors to be the total taxable value of land and additions on the property. | Land | Improvement |
|---|---|---|---|---|
| 2024 | $1,784 | $37,695 | $3,962 | $33,733 |
| 2023 | $1,477 | $26,642 | $2,996 | $23,646 |
| 2022 | $1,447 | $26,642 | $2,996 | $23,646 |
| 2021 | $1,451 | $26,642 | $2,996 | $23,646 |
| 2020 | $1,427 | $22,790 | $2,560 | $20,230 |
| 2019 | $1,418 | $22,790 | $2,560 | $20,230 |
| 2018 | $1,376 | $22,790 | $2,560 | $20,230 |
| 2017 | $1,364 | $21,470 | $2,750 | $18,720 |
| 2016 | $1,346 | $21,470 | $2,750 | $18,720 |
| 2015 | $1,261 | $21,470 | $2,750 | $18,720 |
| 2014 | $1,233 | $21,250 | $2,720 | $18,530 |
| 2013 | $1,222 | $21,250 | $2,720 | $18,530 |
Source: Public Records
Map
Nearby Homes
Your Personal Tour Guide
Ask me questions while you tour the home.