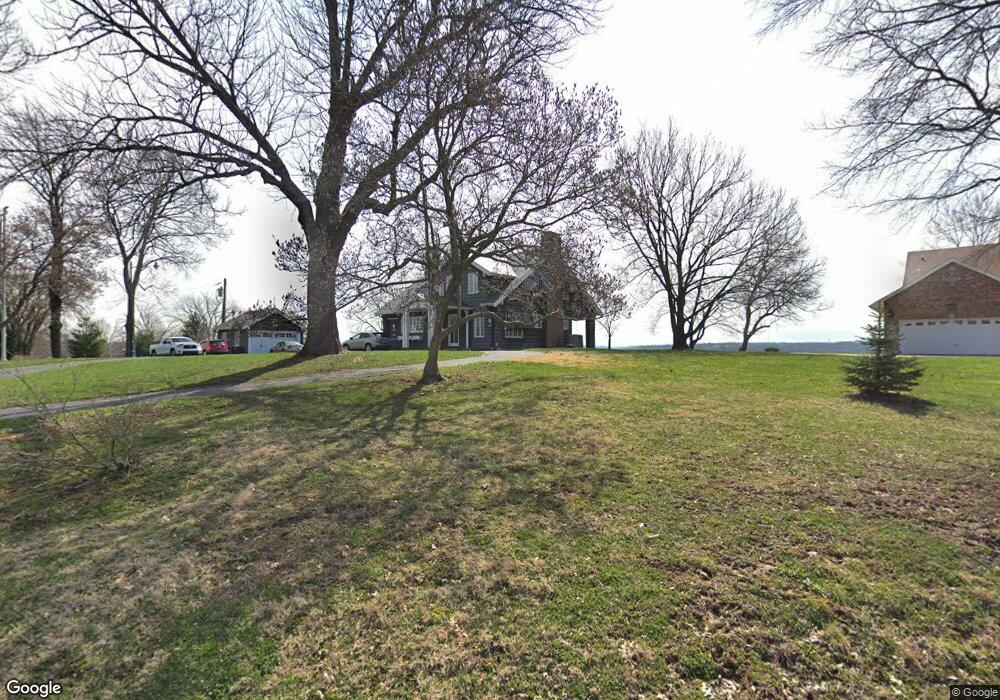
115 Cliff Rd North Bend, OH 45052
Estimated Value: $482,000 - $694,000
4
Beds
1
Bath
2,816
Sq Ft
$209/Sq Ft
Est. Value
About This Home
This home is located at 115 Cliff Rd, North Bend, OH 45052 and is currently estimated at $587,527, approximately $208 per square foot. 115 Cliff Rd is a home located in Hamilton County with nearby schools including Charles T. Young Elementary School, Taylor Middle School, and Taylor High School.
Ownership History
Date
Name
Owned For
Owner Type
Purchase Details
Closed on
Feb 12, 2020
Sold by
Bolser Beverly A and Bolser Anthony E
Bought by
Bolser Anthony E and Bolser Beverly A
Current Estimated Value
Purchase Details
Closed on
Aug 26, 2005
Sold by
Bolser Anthony E
Bought by
Bolser Beverly A
Purchase Details
Closed on
Jul 29, 2004
Sold by
Myers Betty J
Bought by
Bolser Anthony E and Bolser Beverly A
Home Financials for this Owner
Home Financials are based on the most recent Mortgage that was taken out on this home.
Original Mortgage
$391,000
Outstanding Balance
$156,012
Interest Rate
3.5%
Mortgage Type
Fannie Mae Freddie Mac
Estimated Equity
$431,515
Purchase Details
Closed on
Sep 12, 2003
Sold by
Sulau William C
Bought by
Myers Betty J and The Betty J Myers Trust
Purchase Details
Closed on
Sep 11, 2003
Sold by
Myers Betty J
Bought by
Sulau William C
Purchase Details
Closed on
Feb 1, 1999
Sold by
Myers Charles K and Myers Betty J
Bought by
Myers Charles K and The Charles K Myers Trust
Create a Home Valuation Report for This Property
The Home Valuation Report is an in-depth analysis detailing your home's value as well as a comparison with similar homes in the area
Home Values in the Area
Average Home Value in this Area
Purchase History
| Date | Buyer | Sale Price | Title Company |
|---|---|---|---|
| Bolser Anthony E | -- | None Available | |
| Bolser Beverly A | -- | Vintage Title Agency Inc | |
| Bolser Anthony E | $460,000 | Vintage Title Agency Inc | |
| Myers Betty J | -- | -- | |
| Sulau William C | -- | -- | |
| Myers Charles K | -- | -- |
Source: Public Records
Mortgage History
| Date | Status | Borrower | Loan Amount |
|---|---|---|---|
| Open | Bolser Anthony E | $391,000 |
Source: Public Records
Tax History
| Year | Tax Paid | Tax Assessment Tax Assessment Total Assessment is a certain percentage of the fair market value that is determined by local assessors to be the total taxable value of land and additions on the property. | Land | Improvement |
|---|---|---|---|---|
| 2025 | $9,678 | $180,100 | $46,067 | $134,033 |
| 2023 | $9,138 | $180,100 | $46,067 | $134,033 |
| 2022 | $8,869 | $143,598 | $42,994 | $100,604 |
| 2021 | $8,659 | $143,598 | $42,994 | $100,604 |
| 2020 | $8,562 | $143,598 | $42,994 | $100,604 |
| 2019 | $7,952 | $128,212 | $38,388 | $89,824 |
| 2018 | $7,343 | $128,212 | $38,388 | $89,824 |
| 2017 | $7,396 | $128,212 | $38,388 | $89,824 |
| 2016 | $6,040 | $107,314 | $35,319 | $71,995 |
| 2015 | $6,101 | $107,314 | $35,319 | $71,995 |
| 2014 | $6,167 | $107,314 | $35,319 | $71,995 |
| 2013 | $6,734 | $116,645 | $38,388 | $78,257 |
Source: Public Records
Map
Nearby Homes
- 2545 Cliff Rd
- 9568 Mount Nebo Rd
- TBD Do Not Use
- 101 E State Rd
- 22 Skidmore St
- 104 W Laird St
- 122 Spring St
- 221 N Miami Ave
- 311 N Miami Ave
- 550 Aston View Ln
- 310 Spring St
- 8783 Bridgetown Rd
- 8757 Bridgetown Rd
- 3889 Bear Ln
- 3876 Bear Ln
- 1540 Autumn Ridge Dr
- 3843 Indian Brave Trail
- 1522 Autumn Ridge Dr
- 8729 Deer Glen Ct
- 8337 War Admiral Dr
Your Personal Tour Guide
Ask me questions while you tour the home.