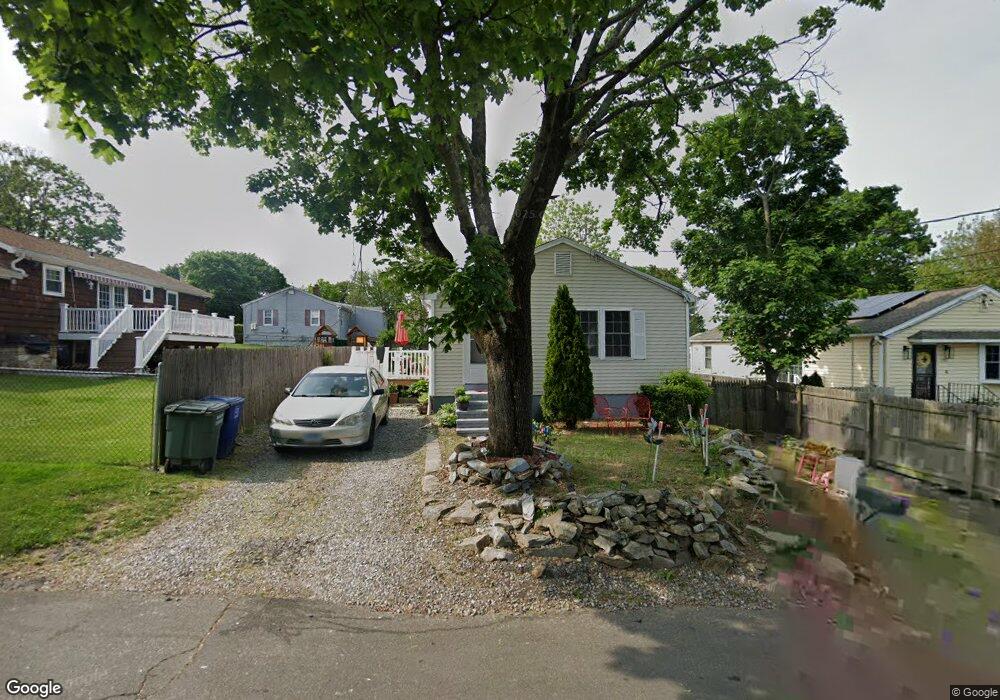
115 Cloverhill Ave Bridgeport, CT 06606
Reservoir-Whiskey Hill NeighborhoodEstimated Value: $306,000 - $410,000
3
Beds
2
Baths
1,056
Sq Ft
$328/Sq Ft
Est. Value
About This Home
This home is located at 115 Cloverhill Ave, Bridgeport, CT 06606 and is currently estimated at $346,802, approximately $328 per square foot. 115 Cloverhill Ave is a home located in Fairfield County with nearby schools including Wilbur L. Cross Elementary School, Central High School, and Northeastern Adventist Academy - Fairfield County.
Ownership History
Date
Name
Owned For
Owner Type
Purchase Details
Closed on
Nov 29, 2004
Sold by
Williams Angela
Bought by
Mcpherson Anthony and Mcpherson Charmaine
Current Estimated Value
Home Financials for this Owner
Home Financials are based on the most recent Mortgage that was taken out on this home.
Original Mortgage
$180,000
Interest Rate
7.05%
Purchase Details
Closed on
Jan 12, 2004
Sold by
Butler Anthony
Bought by
Williams Angela
Purchase Details
Closed on
Jan 18, 2002
Sold by
Ho Dong S
Bought by
Butler Anthony
Purchase Details
Closed on
Aug 15, 1999
Sold by
No Down Payment Llc
Bought by
Mattei Antonio
Purchase Details
Closed on
Jul 31, 1998
Sold by
Fhlmc
Bought by
Miller David
Create a Home Valuation Report for This Property
The Home Valuation Report is an in-depth analysis detailing your home's value as well as a comparison with similar homes in the area
Home Values in the Area
Average Home Value in this Area
Purchase History
| Date | Buyer | Sale Price | Title Company |
|---|---|---|---|
| Mcpherson Anthony | $160,000 | -- | |
| Mcpherson Anthony | $160,000 | -- | |
| Williams Angela | $157,900 | -- | |
| Williams Angela | $157,900 | -- | |
| Butler Anthony | $124,000 | -- | |
| Butler Anthony | $124,000 | -- | |
| Mattei Antonio | $150,000 | -- | |
| Mattei Antonio | $150,000 | -- | |
| Miller David | $44,900 | -- | |
| Miller David | $44,900 | -- |
Source: Public Records
Mortgage History
| Date | Status | Borrower | Loan Amount |
|---|---|---|---|
| Open | Miller David | $210,000 | |
| Closed | Miller David | $180,000 |
Source: Public Records
Tax History Compared to Growth
Tax History
| Year | Tax Paid | Tax Assessment Tax Assessment Total Assessment is a certain percentage of the fair market value that is determined by local assessors to be the total taxable value of land and additions on the property. | Land | Improvement |
|---|---|---|---|---|
| 2025 | $5,823 | $134,020 | $64,930 | $69,090 |
| 2024 | $5,823 | $134,020 | $64,930 | $69,090 |
| 2023 | $5,823 | $134,020 | $64,930 | $69,090 |
| 2022 | $5,823 | $134,020 | $64,930 | $69,090 |
| 2021 | $5,823 | $134,020 | $64,930 | $69,090 |
| 2020 | $5,223 | $96,740 | $37,370 | $59,370 |
| 2019 | $5,223 | $96,740 | $37,370 | $59,370 |
| 2018 | $5,260 | $96,740 | $37,370 | $59,370 |
| 2017 | $5,260 | $96,740 | $37,370 | $59,370 |
| 2016 | $5,260 | $96,740 | $37,370 | $59,370 |
| 2015 | $5,172 | $122,560 | $42,840 | $79,720 |
| 2014 | $5,172 | $122,560 | $42,840 | $79,720 |
Source: Public Records
Map
Nearby Homes
- 182 Trumbull Ave
- 539 Old Town Rd
- 181 Cityview Ave
- 17 Sylvan St
- 438 Soundview Ave
- 165 Yaremich Dr
- 36 Platt St
- 32 Marshall Ave
- 26 Karen Ct Unit A
- 49 Soundview Ave
- 1088 Sylvan Ave
- 135 Grey Rock Rd
- 1053 Sylvan Ave
- 16 Oakdale St
- 7 Stone Ridge Rd
- 717 Reservoir Ave
- 705 Reservoir Ave
- 250 Dayton Rd
- 217 Hillcrest Rd
- 410 Alba Ave
- 295 Fiske Ave
- 125 Cloverhill Ave
- 104 Cloverhill Ave
- 102 Cloverhill Ave
- 135 Cloverhill Ave
- 120 Cloverhill Ave
- 281 Fiske Ave
- 69 Cloverhill Ave
- 130 Voight Ave
- 136 Cloverhill Ave
- 120 Voight Ave
- 59 Cloverhill Ave
- 145 Cloverhill Ave
- 86 Voight Ave
- 140 Voight Ave
- 345 Fiske Ave
- 74 Cloverhill Ave
- 140 Cloverhill Ave
- 76 Voight Ave
- 26 Oakleaf St