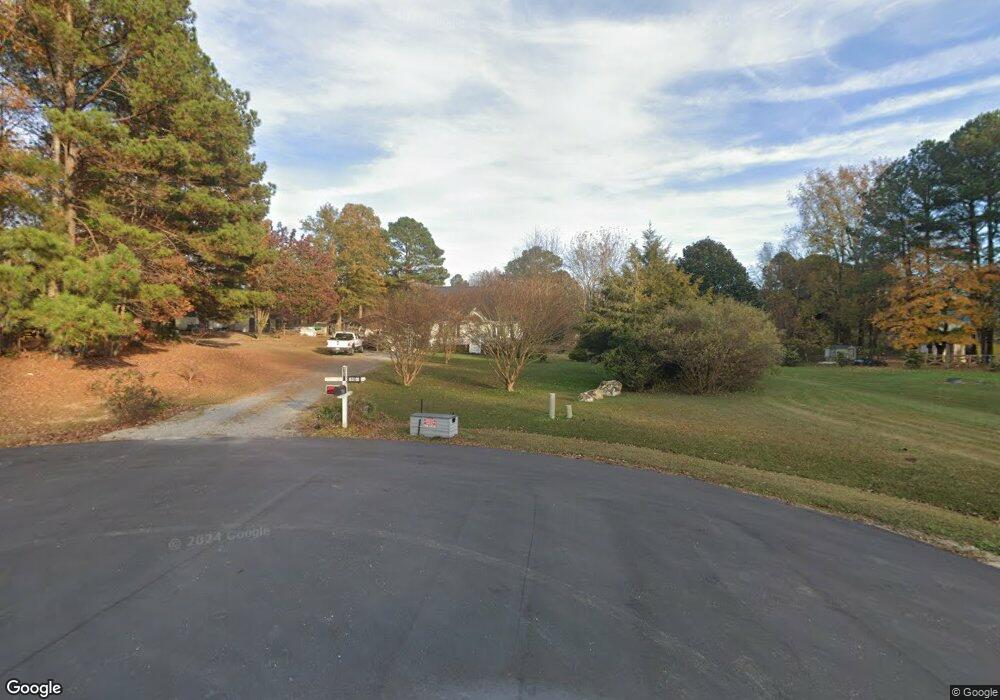
115 Cobey Ct Clayton, NC 27520
Estimated Value: $287,000 - $312,382
3
Beds
3
Baths
1,353
Sq Ft
$220/Sq Ft
Est. Value
About This Home
This home is located at 115 Cobey Ct, Clayton, NC 27520 and is currently estimated at $298,096, approximately $220 per square foot. 115 Cobey Ct is a home located in Johnston County with nearby schools including Polenta Elementary School, Swift Creek Middle, and Cleveland High School.
Ownership History
Date
Name
Owned For
Owner Type
Purchase Details
Closed on
Jul 23, 2013
Sold by
Bryant Kelly L and Proctor Stephen
Bought by
Hamm Danny R and Hamm Sharon E
Current Estimated Value
Home Financials for this Owner
Home Financials are based on the most recent Mortgage that was taken out on this home.
Original Mortgage
$108,007
Outstanding Balance
$77,969
Interest Rate
3.75%
Mortgage Type
FHA
Estimated Equity
$220,127
Purchase Details
Closed on
Apr 10, 2012
Sold by
Bryant Dennis
Bought by
Bryant Kelly L
Purchase Details
Closed on
Oct 26, 2005
Sold by
Sumner Kevin D and Sumner Jessica L
Bought by
Bryant Kelly L and Bryant Dennis Edward
Home Financials for this Owner
Home Financials are based on the most recent Mortgage that was taken out on this home.
Original Mortgage
$104,365
Interest Rate
5.71%
Mortgage Type
FHA
Create a Home Valuation Report for This Property
The Home Valuation Report is an in-depth analysis detailing your home's value as well as a comparison with similar homes in the area
Home Values in the Area
Average Home Value in this Area
Purchase History
| Date | Buyer | Sale Price | Title Company |
|---|---|---|---|
| Hamm Danny R | $110,000 | None Available | |
| Bryant Kelly L | $500 | None Available | |
| Bryant Kelly L | $107,500 | None Available |
Source: Public Records
Mortgage History
| Date | Status | Borrower | Loan Amount |
|---|---|---|---|
| Open | Hamm Danny R | $108,007 | |
| Previous Owner | Bryant Kelly L | $104,365 |
Source: Public Records
Tax History
| Year | Tax Paid | Tax Assessment Tax Assessment Total Assessment is a certain percentage of the fair market value that is determined by local assessors to be the total taxable value of land and additions on the property. | Land | Improvement |
|---|---|---|---|---|
| 2025 | $1,871 | $294,630 | $85,000 | $209,630 |
| 2024 | $1,250 | $154,370 | $44,000 | $110,370 |
| 2023 | $1,208 | $154,370 | $44,000 | $110,370 |
| 2022 | $1,270 | $154,370 | $44,000 | $110,370 |
| 2021 | $1,270 | $154,370 | $44,000 | $110,370 |
| 2020 | $1,285 | $154,370 | $44,000 | $110,370 |
| 2019 | $1,285 | $154,370 | $44,000 | $110,370 |
| 2018 | $995 | $116,690 | $30,000 | $86,690 |
| 2017 | $995 | $116,690 | $30,000 | $86,690 |
| 2016 | $995 | $116,690 | $30,000 | $86,690 |
| 2015 | $995 | $116,690 | $30,000 | $86,690 |
| 2014 | $995 | $116,690 | $30,000 | $86,690 |
Source: Public Records
Map
Nearby Homes
- 0 Government Rd Unit 2434558
- 144 Old Yogi Ln
- 278 Celestial Dr
- 34 Blue Pond Rd
- 167 Great Oak Dr
- 65 Topsail Island Dr
- 181 Telesto Cir
- 193 Big Pine Rd
- 181 Big Pine Rd
- 205 Big Pine Rd
- 145 Big Pine Rd
- 2239 Barber Mill Rd
- 182 Hillmont Dr
- 189 Grey Hawk Dr
- 409 Broadmoor Way
- 812 Winding Oak Way
- 798 Winding Oak Way
- 36 Peninsula Ct
- 2005 Tanglewood Dr
- 109 Dongola St
Your Personal Tour Guide
Ask me questions while you tour the home.