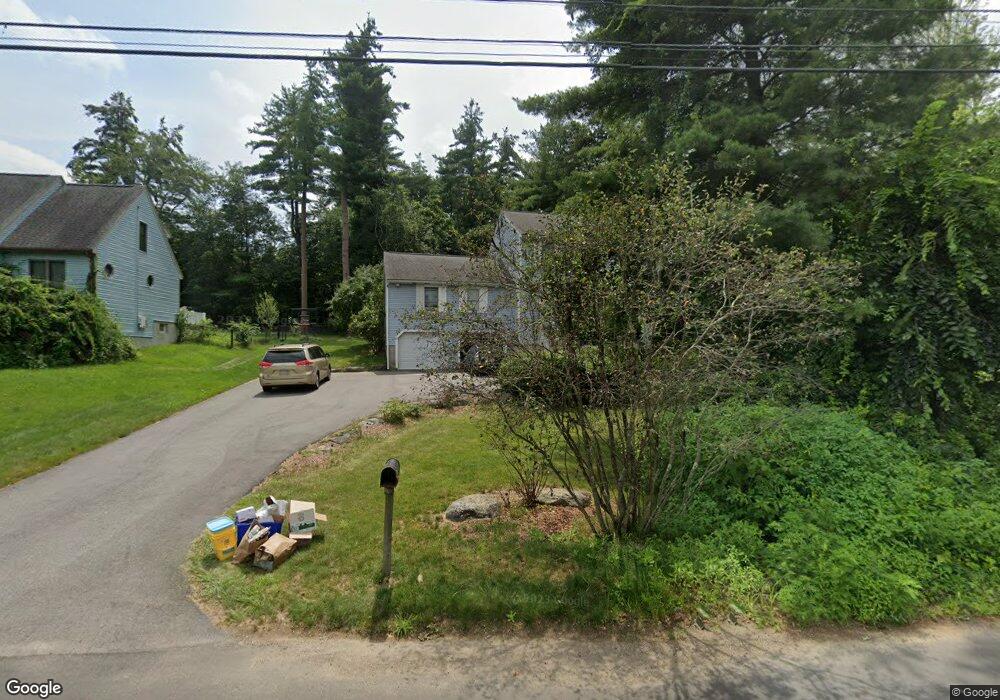
115 Colburn St Northborough, MA 01532
Estimated Value: $711,320 - $785,000
3
Beds
3
Baths
1,900
Sq Ft
$393/Sq Ft
Est. Value
About This Home
This home is located at 115 Colburn St, Northborough, MA 01532 and is currently estimated at $745,830, approximately $392 per square foot. 115 Colburn St is a home located in Worcester County with nearby schools including Marion E. Zeh Elementary School, Robert E. Melican Middle School, and Algonquin Regional High School.
Ownership History
Date
Name
Owned For
Owner Type
Purchase Details
Closed on
May 13, 1998
Sold by
Mutalik Madhav and Mutalik Sujata
Bought by
Shek Jonathan Hui and Shek Angela Haibei
Current Estimated Value
Purchase Details
Closed on
Dec 7, 1989
Sold by
Crutcher Eileen
Bought by
Mutalik Madhav
Create a Home Valuation Report for This Property
The Home Valuation Report is an in-depth analysis detailing your home's value as well as a comparison with similar homes in the area
Home Values in the Area
Average Home Value in this Area
Purchase History
| Date | Buyer | Sale Price | Title Company |
|---|---|---|---|
| Shek Jonathan Hui | $217,500 | -- | |
| Mutalik Madhav | $208,127 | -- |
Source: Public Records
Mortgage History
| Date | Status | Borrower | Loan Amount |
|---|---|---|---|
| Open | Mutalik Madhav | $157,500 | |
| Closed | Mutalik Madhav | $159,000 | |
| Closed | Mutalik Madhav | $160,800 |
Source: Public Records
Tax History Compared to Growth
Tax History
| Year | Tax Paid | Tax Assessment Tax Assessment Total Assessment is a certain percentage of the fair market value that is determined by local assessors to be the total taxable value of land and additions on the property. | Land | Improvement |
|---|---|---|---|---|
| 2025 | $9,096 | $638,300 | $238,000 | $400,300 |
| 2024 | $8,231 | $576,400 | $192,700 | $383,700 |
| 2023 | $7,553 | $510,700 | $181,700 | $329,000 |
| 2022 | $7,204 | $436,900 | $173,000 | $263,900 |
| 2021 | $6,939 | $405,300 | $157,200 | $248,100 |
| 2020 | $7,105 | $411,900 | $157,200 | $254,700 |
| 2019 | $7,088 | $413,300 | $157,200 | $256,100 |
| 2018 | $6,829 | $392,700 | $153,400 | $239,300 |
| 2017 | $6,685 | $384,400 | $153,400 | $231,000 |
| 2016 | $6,542 | $381,000 | $150,000 | $231,000 |
| 2015 | $6,155 | $367,900 | $158,200 | $209,700 |
| 2014 | $5,916 | $356,600 | $158,200 | $198,400 |
Source: Public Records
Map
Nearby Homes