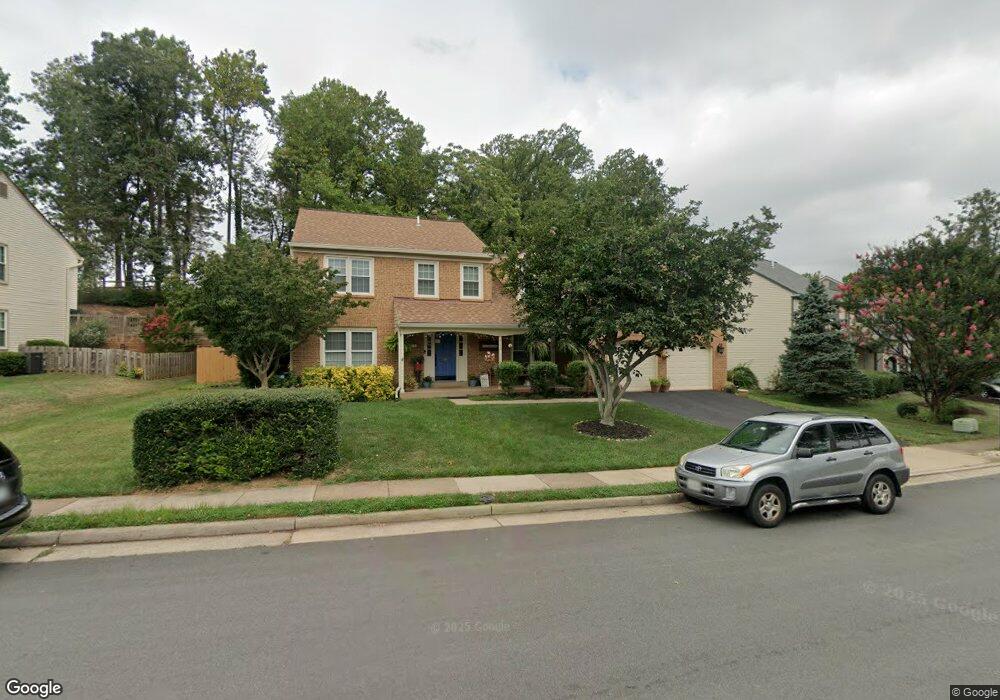
115 Connemara Dr Sterling, VA 20164
Estimated Value: $750,979 - $800,000
4
Beds
4
Baths
2,042
Sq Ft
$385/Sq Ft
Est. Value
About This Home
This home is located at 115 Connemara Dr, Sterling, VA 20164 and is currently estimated at $785,245, approximately $384 per square foot. 115 Connemara Dr is a home located in Loudoun County with nearby schools including Sterling Elementary School, Sterling Middle School, and Park View High School.
Ownership History
Date
Name
Owned For
Owner Type
Purchase Details
Closed on
Apr 7, 2021
Sold by
Veira Eliana
Bought by
Veira Eliana and Veira Carlos
Current Estimated Value
Purchase Details
Closed on
Jul 9, 2004
Sold by
Salvatore Michael A
Bought by
Veira Eliana
Home Financials for this Owner
Home Financials are based on the most recent Mortgage that was taken out on this home.
Original Mortgage
$388,000
Outstanding Balance
$195,106
Interest Rate
6.32%
Mortgage Type
New Conventional
Estimated Equity
$590,139
Purchase Details
Closed on
Oct 30, 1995
Sold by
Mcgowan James P
Bought by
Salvatore Michaeal A
Home Financials for this Owner
Home Financials are based on the most recent Mortgage that was taken out on this home.
Original Mortgage
$152,800
Interest Rate
7.6%
Create a Home Valuation Report for This Property
The Home Valuation Report is an in-depth analysis detailing your home's value as well as a comparison with similar homes in the area
Home Values in the Area
Average Home Value in this Area
Purchase History
| Date | Buyer | Sale Price | Title Company |
|---|---|---|---|
| Veira Eliana | -- | None Available | |
| Veira Eliana | $485,000 | -- | |
| Salvatore Michaeal A | $191,000 | -- |
Source: Public Records
Mortgage History
| Date | Status | Borrower | Loan Amount |
|---|---|---|---|
| Open | Veira Eliana | $388,000 | |
| Previous Owner | Salvatore Michaeal A | $152,800 |
Source: Public Records
Tax History Compared to Growth
Tax History
| Year | Tax Paid | Tax Assessment Tax Assessment Total Assessment is a certain percentage of the fair market value that is determined by local assessors to be the total taxable value of land and additions on the property. | Land | Improvement |
|---|---|---|---|---|
| 2025 | $5,899 | $732,800 | $258,500 | $474,300 |
| 2024 | $5,613 | $648,910 | $238,500 | $410,410 |
| 2023 | $5,700 | $651,450 | $238,500 | $412,950 |
| 2022 | $5,364 | $602,650 | $188,500 | $414,150 |
| 2021 | $5,323 | $543,140 | $178,500 | $364,640 |
| 2020 | $5,161 | $498,650 | $167,500 | $331,150 |
| 2019 | $4,961 | $474,780 | $157,500 | $317,280 |
| 2018 | $5,073 | $467,580 | $157,500 | $310,080 |
| 2017 | $5,306 | $471,660 | $157,500 | $314,160 |
| 2016 | $5,305 | $463,310 | $0 | $0 |
| 2015 | $5,214 | $301,870 | $0 | $301,870 |
| 2014 | $5,263 | $298,200 | $0 | $298,200 |
Source: Public Records
Map
Nearby Homes
- 46440 Beartown Dr
- 21914 Hawksbill High Cir Unit 304
- 46320 Mount Milstead Terrace Unit 100
- 46320 Mount Milstead Terrace Unit 301
- 104 W Amhurst Place
- 21460 Mount Sterling Terrace Unit 102
- 21460 Mount Sterling Terrace Unit 103
- 21228 Mcfadden Square Unit 411
- 304 E Gordon St
- 312 E Gordon St
- 805 N York Rd
- 21073 Semblance Dr
- 46823 Gunflint Way
- 814 N Croydon St
- 21439 Kenyon Ct
- 46699 Paragon Terrace
- 502 Giles Place
- 500 Giles Place
- 100 Marcum Ct
- 32 Cedar Dr
- 111 Connemara Dr
- 116 Connemara Dr
- 118 Connemara Dr
- 119 Connemara Dr
- 114 Connemara Dr
- 109 Connemara Dr
- 202 Edenberry Ct
- 112 Connemara Dr
- 21386 Potomac View Rd
- 121 Connemara Dr
- 120 Connemara Dr
- 110 Connemara Dr
- 107 Connemara Dr
- 203 Edenberry Ct
- 204 Edenberry Ct
- 108 Connemara Dr
- 123 Connemara Dr
- 46455 White Top Dr
- 122 Connemara Dr
- 46404 Blackrock Summit Terrace