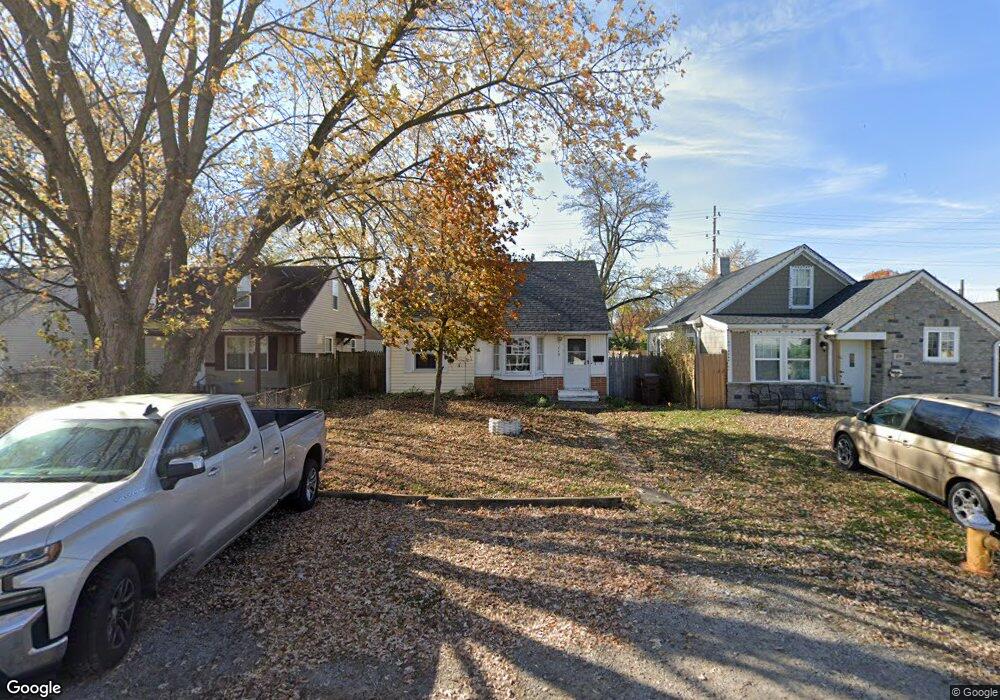
115 Coolidge Ave Columbus, OH 43228
Estimated Value: $143,000 - $167,447
3
Beds
1
Bath
1,077
Sq Ft
$145/Sq Ft
Est. Value
About This Home
This home is located at 115 Coolidge Ave, Columbus, OH 43228 and is currently estimated at $156,112, approximately $144 per square foot. 115 Coolidge Ave is a home located in Franklin County with nearby schools including Prairie Lincoln Elementary School, Galloway Ridge Intermediate School, and Norton Middle School.
Ownership History
Date
Name
Owned For
Owner Type
Purchase Details
Closed on
Sep 24, 2020
Sold by
Wilmington Savings Fund Society Fsb
Bought by
Arich Star Llc
Current Estimated Value
Purchase Details
Closed on
Feb 1, 2017
Sold by
Sg Capital Partners Llc
Bought by
The Dexter Group Trust
Purchase Details
Closed on
Sep 30, 2010
Sold by
Fannie Mae
Bought by
Harbour Portfolio Vi Lp
Purchase Details
Closed on
May 3, 2010
Sold by
Schaffnit Stephanie
Bought by
Federal National Mortgage Association
Purchase Details
Closed on
Aug 7, 2006
Sold by
Realistic Investors Llc
Bought by
Schaffnit Stephanie
Purchase Details
Closed on
Apr 7, 2006
Sold by
Ransier Frederick L and Pancake Rebecca E
Bought by
Realistic Investors Llc
Purchase Details
Closed on
Aug 18, 1988
Bought by
Pancake Rebecca E
Create a Home Valuation Report for This Property
The Home Valuation Report is an in-depth analysis detailing your home's value as well as a comparison with similar homes in the area
Home Values in the Area
Average Home Value in this Area
Purchase History
| Date | Buyer | Sale Price | Title Company |
|---|---|---|---|
| Arich Star Llc | $29,235 | None Available | |
| The Dexter Group Trust | $25,473 | None Available | |
| Harbour Portfolio Vi Lp | $6,900 | Attorney | |
| Federal National Mortgage Association | $71,160 | Attorney | |
| Schaffnit Stephanie | -- | Christopher | |
| Realistic Investors Llc | $52,000 | Title Co Lt | |
| Pancake Rebecca E | -- | -- |
Source: Public Records
Tax History Compared to Growth
Tax History
| Year | Tax Paid | Tax Assessment Tax Assessment Total Assessment is a certain percentage of the fair market value that is determined by local assessors to be the total taxable value of land and additions on the property. | Land | Improvement |
|---|---|---|---|---|
| 2024 | $2,530 | $48,520 | $8,510 | $40,010 |
| 2023 | $2,517 | $48,510 | $8,505 | $40,005 |
| 2022 | $1,680 | $22,270 | $6,970 | $15,300 |
| 2021 | $1,788 | $22,270 | $6,970 | $15,300 |
| 2020 | $1,855 | $22,270 | $6,970 | $15,300 |
| 2019 | $1,388 | $17,370 | $6,060 | $11,310 |
| 2018 | $767 | $17,370 | $6,060 | $11,310 |
| 2017 | $1,426 | $17,370 | $6,060 | $11,310 |
| 2016 | $1,867 | $22,060 | $4,450 | $17,610 |
| 2015 | $868 | $22,060 | $4,450 | $17,610 |
| 2014 | $1,737 | $22,060 | $4,450 | $17,610 |
| 2013 | $948 | $24,500 | $4,935 | $19,565 |
Source: Public Records
Map
Nearby Homes
- 147 Coolidge Ave
- 94 Florence Ave
- 139 Demorest Ave
- 195 S Sylvan Ave
- 3938 Halsey Place
- 38 Powhatan Ave
- 4006 Halsey Place
- 638 Fairmoor Place
- 3831 Fairmoor Rd
- 36-38 Orel Ave
- 133 S Brinker Ave
- 77 S Brinker Ave
- 99 N Brinker Ave Unit 101
- 0 S Brinker Ave
- 644 Georgian Dr
- 3300-3302 Sullivant Ave
- 3276-3278 Sullivant Ave
- 4202 Atlanta Dr
- 743 Holly Hill Dr
- 617 Athens St
- 121 Coolidge Ave
- 109 Coolidge Ave
- 125 Coolidge Ave
- 103 Coolidge Ave
- 99 Coolidge Ave
- 131 Coolidge Ave
- 95 Coolidge Ave
- 137 Coolidge Ave
- 116 Coolidge Ave
- 110 Coolidge Ave
- 122 Coolidge Ave
- 89 Coolidge Ave
- 141 Coolidge Ave
- 106 Coolidge Ave
- 126 Coolidge Ave
- 100 Coolidge Ave
- 132 Coolidge Ave
- 92 Annette St
- 94 Coolidge Ave
- 138 Coolidge Ave