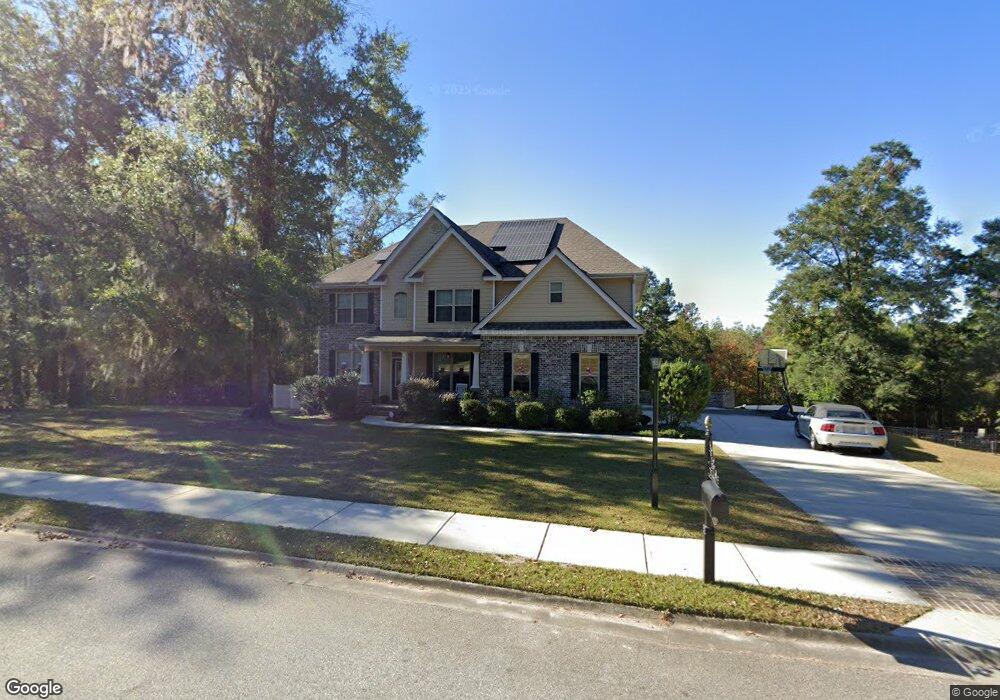
115 Crestview Dr Guyton, GA 31312
Estimated Value: $530,000 - $671,000
6
Beds
4
Baths
4,600
Sq Ft
$134/Sq Ft
Est. Value
About This Home
This home is located at 115 Crestview Dr, Guyton, GA 31312 and is currently estimated at $614,136, approximately $133 per square foot. 115 Crestview Dr is a home located in Effingham County with nearby schools including Marlow Elementary School, South Effingham Middle School, and South Effingham High School.
Ownership History
Date
Name
Owned For
Owner Type
Purchase Details
Closed on
Mar 15, 2019
Sold by
Faircloth Homes Of Savannah Inc
Bought by
Hester Monica T
Current Estimated Value
Home Financials for this Owner
Home Financials are based on the most recent Mortgage that was taken out on this home.
Original Mortgage
$386,910
Outstanding Balance
$338,068
Interest Rate
4.3%
Mortgage Type
New Conventional
Estimated Equity
$276,068
Purchase Details
Closed on
Mar 24, 2017
Sold by
Bgn Investments Llc
Bought by
Faircloth Homes Of Savannah In
Home Financials for this Owner
Home Financials are based on the most recent Mortgage that was taken out on this home.
Original Mortgage
$264,675
Interest Rate
4.16%
Mortgage Type
Purchase Money Mortgage
Purchase Details
Closed on
Jul 3, 2013
Sold by
Howze Gregg Inc
Bought by
South Georgia Bank
Purchase Details
Closed on
Nov 1, 2000
Bought by
Howze Gregg Inc
Create a Home Valuation Report for This Property
The Home Valuation Report is an in-depth analysis detailing your home's value as well as a comparison with similar homes in the area
Home Values in the Area
Average Home Value in this Area
Purchase History
| Date | Buyer | Sale Price | Title Company |
|---|---|---|---|
| Hester Monica T | $429,900 | -- | |
| Faircloth Homes Of Savannah In | $40,000 | -- | |
| South Georgia Bank | -- | -- | |
| Howze Gregg Inc | -- | -- |
Source: Public Records
Mortgage History
| Date | Status | Borrower | Loan Amount |
|---|---|---|---|
| Open | Hester Monica T | $386,910 | |
| Previous Owner | Faircloth Homes Of Savannah In | $264,675 |
Source: Public Records
Tax History
| Year | Tax Paid | Tax Assessment Tax Assessment Total Assessment is a certain percentage of the fair market value that is determined by local assessors to be the total taxable value of land and additions on the property. | Land | Improvement |
|---|---|---|---|---|
| 2025 | $5,304 | $215,563 | $31,200 | $184,363 |
| 2024 | $5,304 | $232,136 | $31,200 | $200,936 |
| 2023 | $4,039 | $194,024 | $31,200 | $162,824 |
| 2022 | $4,599 | $181,624 | $18,800 | $162,824 |
| 2021 | $4,509 | $146,582 | $18,000 | $128,582 |
| 2020 | $4,959 | $163,706 | $18,000 | $145,706 |
| 2019 | $4,776 | $153,380 | $18,000 | $135,380 |
| 2018 | $4,497 | $143,340 | $18,000 | $125,340 |
| 2017 | $542 | $18,000 | $18,000 | $0 |
| 2016 | $252 | $8,800 | $8,800 | $0 |
| 2015 | -- | $8,800 | $8,800 | $0 |
| 2014 | -- | $8,000 | $8,000 | $0 |
| 2013 | -- | $8,900 | $8,900 | $0 |
Source: Public Records
Map
Nearby Homes
- 113 Vintage Dr
- 111 Vintage Dr
- 114 Carriage House Dr
- 91 Crestview Dr
- 180 Royal Oak Dr
- 128 Watson Mill Rd
- 142 Watson Mill Rd
- 127 Watson Mill Rd
- 134 Watson Mill Rd
- 104 Concord Dr
- 73 Crestview Dr
- 100 Concord Dr
- 106 Concord Dr
- 125 Watson Mill Rd
- 110 Concord Dr
- 117 Concord Dr
- 113 Concord Dr
- 115 Concord Dr
- 132 Royal Oak Dr
- 111 Juniper Dr
- 113 Crestview Dr
- 117 Crestview Dr
- 94 Crestview Dr
- 88 Crestview Dr
- 92 Crestview Dr
- 96 Crestview Dr
- 111 Crestview Dr
- 118 Crestview Dr
- 118 Crestview Dr Unit 53
- 120 Crestview Dr
- 119 Crestview Dr
- 116 Crestview Dr
- 124 Crestview Dr
- 109 Crestview Dr
- 112 Crestview Dr
- 119 Vintage Dr
- 121 Vintage Dr
- 121 Crestview Dr
- 117 Vintage Dr
- 115 Vintage Dr
Your Personal Tour Guide
Ask me questions while you tour the home.