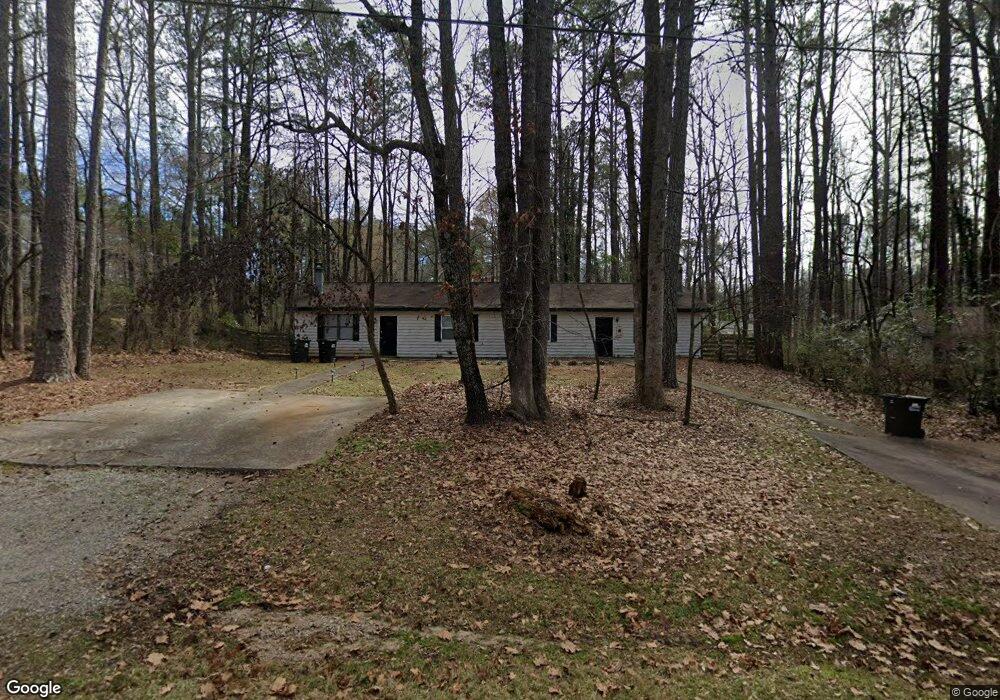
115 Crows Nest Ct Athens, GA 30605
Cedar Creek NeighborhoodEstimated Value: $188,000 - $231,000
2
Beds
1
Bath
972
Sq Ft
$211/Sq Ft
Est. Value
About This Home
This home is located at 115 Crows Nest Ct, Athens, GA 30605 and is currently estimated at $205,568, approximately $211 per square foot. 115 Crows Nest Ct is a home located in Clarke County with nearby schools including Whit Davis Road Elementary School, Hilsman Middle School, and Cedar Shoals High School.
Ownership History
Date
Name
Owned For
Owner Type
Purchase Details
Closed on
Mar 4, 2022
Sold by
Athens Rental Houses Llc
Bought by
Hbi Home Solutions Llc
Current Estimated Value
Home Financials for this Owner
Home Financials are based on the most recent Mortgage that was taken out on this home.
Original Mortgage
$135,000
Interest Rate
3.69%
Mortgage Type
New Conventional
Purchase Details
Closed on
Feb 2, 2007
Sold by
Not Provided
Bought by
Athens Rental Houses Llc
Home Financials for this Owner
Home Financials are based on the most recent Mortgage that was taken out on this home.
Original Mortgage
$77,000
Interest Rate
6.08%
Mortgage Type
New Conventional
Purchase Details
Closed on
Aug 9, 1996
Sold by
Wilbanks Gerald J and Wilbanks Iris H
Bought by
Edwards John W
Purchase Details
Closed on
Aug 21, 1990
Sold by
Gilbert C D
Bought by
Wilbanks Gerald J and Wilbanks Iris H
Purchase Details
Closed on
Aug 2, 1989
Sold by
Holloway Alfred M
Bought by
Gilbert C D
Create a Home Valuation Report for This Property
The Home Valuation Report is an in-depth analysis detailing your home's value as well as a comparison with similar homes in the area
Home Values in the Area
Average Home Value in this Area
Purchase History
| Date | Buyer | Sale Price | Title Company |
|---|---|---|---|
| Hbi Home Solutions Llc | $133,000 | -- | |
| Athens Rental Houses Llc | -- | -- | |
| Edwards John W | $76,900 | -- | |
| Wilbanks Gerald J | $58,000 | -- | |
| Gilbert C D | $58,000 | -- |
Source: Public Records
Mortgage History
| Date | Status | Borrower | Loan Amount |
|---|---|---|---|
| Closed | Hbi Home Solutions Llc | $135,000 | |
| Previous Owner | Athens Rental Houses Llc | $77,000 |
Source: Public Records
Tax History Compared to Growth
Tax History
| Year | Tax Paid | Tax Assessment Tax Assessment Total Assessment is a certain percentage of the fair market value that is determined by local assessors to be the total taxable value of land and additions on the property. | Land | Improvement |
|---|---|---|---|---|
| 2025 | $2,603 | $83,820 | $12,000 | $71,820 |
| 2024 | $1,663 | $53,200 | $10,400 | $42,800 |
| 2023 | $1,663 | $53,200 | $10,400 | $42,800 |
| 2022 | $1,697 | $53,200 | $10,400 | $42,800 |
| 2021 | $1,566 | $46,454 | $8,000 | $38,454 |
| 2020 | $1,408 | $41,785 | $8,000 | $33,785 |
| 2019 | $1,234 | $36,336 | $8,000 | $28,336 |
| 2018 | $934 | $27,506 | $8,000 | $19,506 |
| 2017 | $917 | $27,004 | $8,000 | $19,004 |
| 2016 | $803 | $23,654 | $8,000 | $15,654 |
| 2015 | $680 | $20,000 | $8,000 | $12,000 |
| 2014 | $681 | $20,000 | $8,000 | $12,000 |
Source: Public Records
Map
Nearby Homes
- 110 Studio Ct
- 110112 Crows Nest Ct
- 125 Crows Nest Ct
- 125 Crows Nest Ct Unit n/a
- 120 Studio Ct
- 110 Crows Nest Ct
- 150 Crows Nest Ct
- 115117 Studio Ct
- 120 122 Crows Nest Ct
- 120 Crows Nest Ct
- 120 Crows Nest Ct Unit 122
- 150 Studio Ct
- 100 Highland Park Dr
- 115 Studio Ct
- 117 Studio Ct
- 106 Highland Park Dr
- 1535 Cedar Shoals Dr
- 125 Studio Ct
- 1510 Cedar Shoals Dr
- 1545 Cedar Shoals Dr