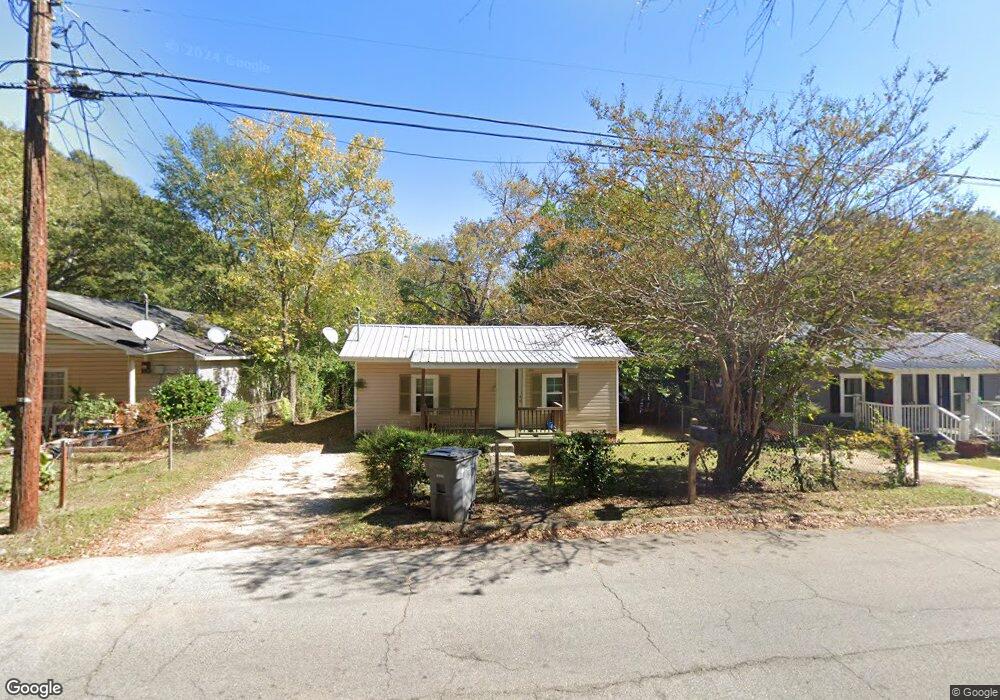
115 Daniel St Lagrange, GA 30241
Estimated Value: $58,000 - $76,000
2
Beds
1
Bath
990
Sq Ft
$70/Sq Ft
Est. Value
About This Home
This home is located at 115 Daniel St, Lagrange, GA 30241 and is currently estimated at $69,262, approximately $69 per square foot. 115 Daniel St is a home located in Troup County with nearby schools including Hollis Hand Elementary School, Franklin Forest Elementary School, and Ethel W. Kight Elementary School.
Ownership History
Date
Name
Owned For
Owner Type
Purchase Details
Closed on
Apr 5, 2023
Sold by
Cavender Ronald Steven Estate
Bought by
Cavender Rentals Llc
Current Estimated Value
Purchase Details
Closed on
Feb 2, 1999
Sold by
Allen Wood
Bought by
Cavender Steve
Purchase Details
Closed on
Nov 11, 1996
Sold by
Don Rainey Food Store Inc
Bought by
Allen Wood
Purchase Details
Closed on
Sep 19, 1996
Sold by
First Federal
Bought by
Don Rainey Food Store Inc
Purchase Details
Closed on
May 15, 1996
Sold by
Grady Tucker
Bought by
First Federal
Purchase Details
Closed on
Sep 28, 1992
Sold by
Tucker Grady and Tucker Lucy
Bought by
Grady Tucker
Purchase Details
Closed on
Jul 22, 1989
Sold by
Lucy Billy and Lucy Beasley
Bought by
Tucker Grady and Tucker Lucy
Purchase Details
Closed on
Jan 1, 1986
Sold by
Tommie Vivian Dial
Bought by
Lucy Billy and Lucy Beasley
Purchase Details
Closed on
Jan 1, 1962
Sold by
Mrs Georgia Owens
Bought by
Tommie Vivian Dial
Create a Home Valuation Report for This Property
The Home Valuation Report is an in-depth analysis detailing your home's value as well as a comparison with similar homes in the area
Purchase History
| Date | Buyer | Sale Price | Title Company |
|---|---|---|---|
| Cavender Rentals Llc | -- | -- | |
| Cavender Steve | $10,000 | -- | |
| Allen Wood | $5,000 | -- | |
| Don Rainey Food Store Inc | $4,500 | -- | |
| First Federal | -- | -- | |
| Grady Tucker | -- | -- | |
| Tucker Grady | $22,500 | -- | |
| Lucy Billy | $7,500 | -- | |
| Tommie Vivian Dial | -- | -- |
Source: Public Records
Tax History
| Year | Tax Paid | Tax Assessment Tax Assessment Total Assessment is a certain percentage of the fair market value that is determined by local assessors to be the total taxable value of land and additions on the property. | Land | Improvement |
|---|---|---|---|---|
| 2025 | $508 | $18,640 | $3,320 | $15,320 |
| 2024 | $473 | $17,360 | $3,320 | $14,040 |
| 2023 | $427 | $15,640 | $3,320 | $12,320 |
| 2022 | $451 | $16,160 | $3,320 | $12,840 |
| 2021 | $162 | $5,360 | $1,880 | $3,480 |
| 2020 | $162 | $5,360 | $1,880 | $3,480 |
| 2019 | $133 | $4,400 | $1,480 | $2,920 |
| 2018 | $127 | $4,195 | $1,275 | $2,920 |
| 2017 | $127 | $4,195 | $1,275 | $2,920 |
| 2016 | $126 | $4,173 | $1,275 | $2,898 |
| 2015 | $131 | $4,322 | $1,424 | $2,898 |
| 2014 | $131 | $4,322 | $1,424 | $2,898 |
| 2013 | -- | $5,672 | $1,898 | $3,774 |
Source: Public Records
Map
Nearby Homes
- 117 Daniel St
- 113 Daniel St
- 111 Daniel St
- 0 NE Davis By Pass and Big Spring Unit 7075098
- 109 1/2 Daniel St
- 316 Render St
- 318 Render St
- 314 Render St
- 312 Render St
- 310 Render St
- 320 Render St
- 0 Belk St Unit 64 7497004
- 0 Belk St Unit 66 7496996
- 0 Belk St Unit 65 7496997
- 0 Belk St Unit 58 7505011
- 304 Render St
- 619 Ware St
- 315 Render St
- 519 Ware St
- 105 Daniel St
Your Personal Tour Guide
Ask me questions while you tour the home.