115 Dean St Raynham, MA 02767
Estimated Value: $565,000 - $697,000
About This Home
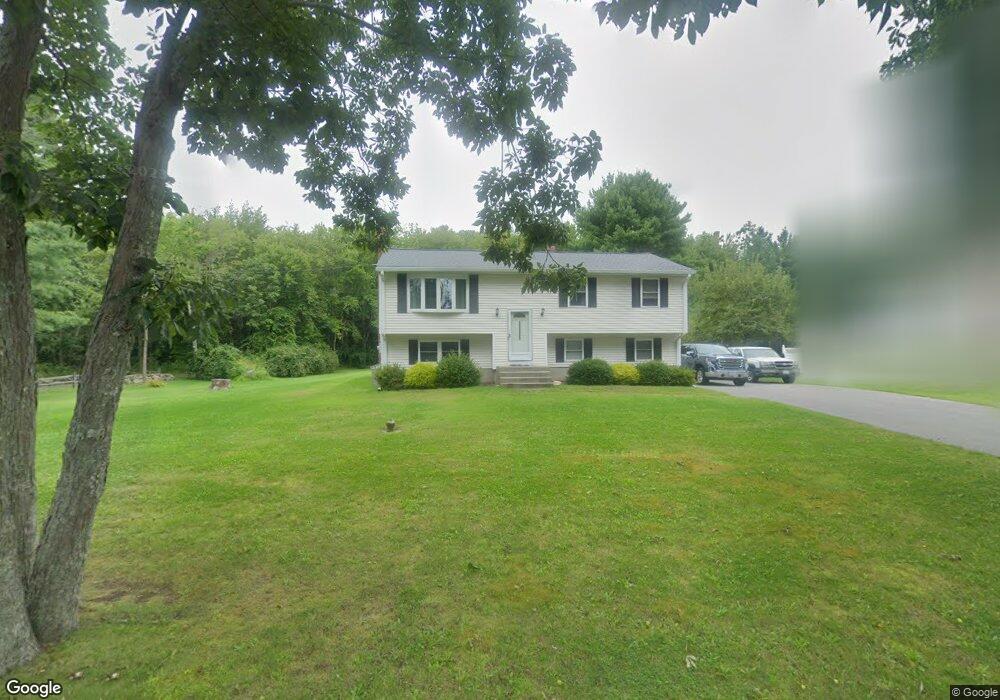
This home is located at 115 Dean St, Raynham, MA 02767 and is currently estimated at $610,704, approximately $330 per square foot. 115 Dean St is a home located in Bristol County with nearby schools including LaLiberte Elementary School, Merrill Elementary School, and Williams Intermediate School.
Ownership History
We collect this data history from publicly available records. To have your information removed, we recommend requesting removal directly through your county’s website.
Purchase Details
Purchase Details
Home Values in the Area
Average Home Value in this Area
Purchase History
We collect this data history from publicly available records. To have your information removed, we recommend requesting removal directly through your county’s website.
| Date | Buyer | Sale Price | Title Company |
|---|---|---|---|
| -- | None Available | ||
| $52,000 | -- |
Mortgage History
We collect this data history from publicly available records. To have your information removed, we recommend requesting removal directly through your county’s website.
| Date | Status | Borrower | Loan Amount |
|---|---|---|---|
| Previous Owner | $40,000 | ||
| Previous Owner | $15,000 |
Tax History
We collect this data history from publicly available records. To have your information removed, we recommend requesting removal directly through your county’s website.
| Year | Tax Paid | Tax Assessment Tax Assessment Total Assessment is a certain percentage of the fair market value that is determined by local assessors to be the total taxable value of land and additions on the property. | Land | Improvement |
|---|---|---|---|---|
| 2025 | $5,836 | $482,300 | $200,000 | $282,300 |
| 2024 | $5,896 | $474,700 | $192,400 | $282,300 |
| 2023 | $5,613 | $412,700 | $173,100 | $239,600 |
| 2022 | $5,432 | $366,300 | $153,900 | $212,400 |
| 2021 | $5,150 | $350,600 | $146,200 | $204,400 |
| 2020 | $4,961 | $344,300 | $146,200 | $198,100 |
| 2019 | $4,899 | $344,300 | $146,200 | $198,100 |
| 2018 | $4,716 | $316,500 | $146,200 | $170,300 |
| 2017 | $4,420 | $294,100 | $138,500 | $155,600 |
| 2016 | $4,359 | $291,000 | $135,400 | $155,600 |
| 2015 | $3,906 | $256,300 | $136,600 | $119,700 |
Map
- 27 Gretchen Way
- 0 Oxbow Rd 46-1
- 0 Oxbow Rd Unit 46-1
- 0 Oxbow Rd Unit 39-3
- 0 Oxbow Rd Unit 45-2
- 68 Oxbow Unit 41-1
- 105 Oxbow Rd Unit 47-3
- 74 Oxbow Unit 45-1
- 532 Hill St
- 46 Louie Ln
- 58 Shirley Rd
- 55 Bally Dr
- 54 Georges Loop
- 48 Easy St
- 0 Richmond St
- 82 Georges Loop
- 4 Emerald Place
- 2 Emerald Place
- 222 Dolan Cir
- 33 Margaret Rd
Ask me questions while you tour the home.