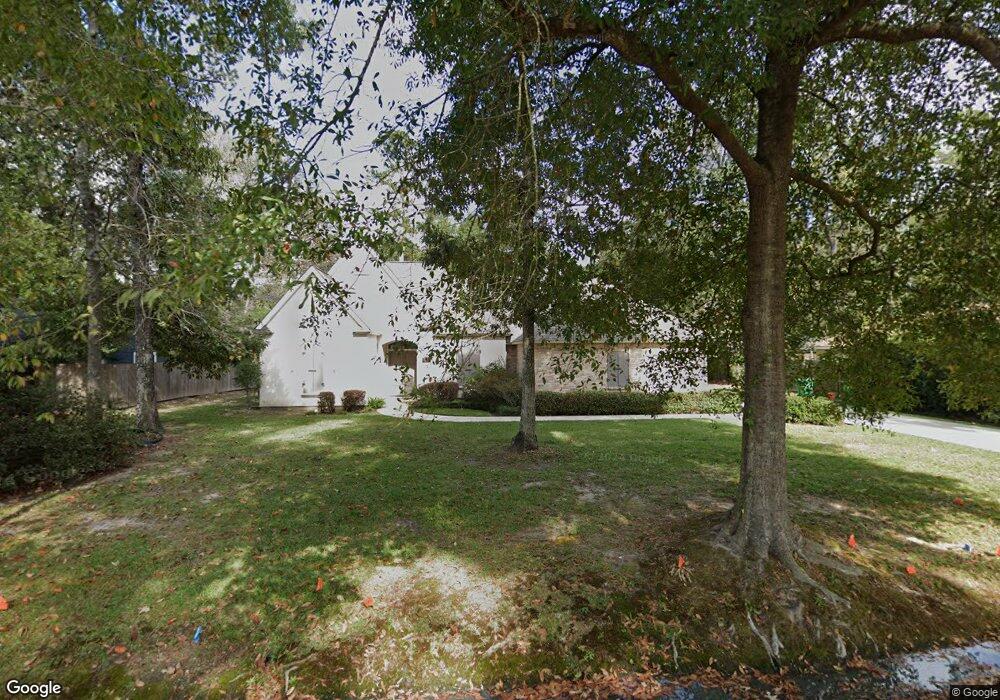
115 Devon Dr Mandeville, LA 70448
Estimated Value: $376,899 - $431,000
Studio
--
Bath
2,277
Sq Ft
$178/Sq Ft
Est. Value
About This Home
This home is located at 115 Devon Dr, Mandeville, LA 70448 and is currently estimated at $404,225, approximately $177 per square foot. 115 Devon Dr is a home with nearby schools including Mandeville Elementary School, Lake Harbor Middle School, and Mandeville Junior High School.
Ownership History
Date
Name
Owned For
Owner Type
Purchase Details
Closed on
Sep 20, 2013
Sold by
May Investments Llc
Bought by
May Genevieve Lynn
Current Estimated Value
Home Financials for this Owner
Home Financials are based on the most recent Mortgage that was taken out on this home.
Original Mortgage
$339,138
Outstanding Balance
$250,487
Interest Rate
4.45%
Mortgage Type
VA
Estimated Equity
$153,738
Purchase Details
Closed on
Feb 28, 2013
Sold by
Carter Howell and Carter Susan Post
Bought by
Coa Fred May Investments Llc and Id May
Purchase Details
Closed on
Feb 19, 2010
Sold by
Bodet Christopher S
Bought by
Post Susan Leslie and Carter Howell
Create a Home Valuation Report for This Property
The Home Valuation Report is an in-depth analysis detailing your home's value as well as a comparison with similar homes in the area
Home Values in the Area
Average Home Value in this Area
Purchase History
| Date | Buyer | Sale Price | Title Company |
|---|---|---|---|
| May Genevieve Lynn | $332,000 | Multiple | |
| Coa Fred May Investments Llc | $60,000 | Multiple | |
| Post Susan Leslie | $65,000 | None Available |
Source: Public Records
Mortgage History
| Date | Status | Borrower | Loan Amount |
|---|---|---|---|
| Open | May Genevieve Lynn | $339,138 |
Source: Public Records
Tax History
| Year | Tax Paid | Tax Assessment Tax Assessment Total Assessment is a certain percentage of the fair market value that is determined by local assessors to be the total taxable value of land and additions on the property. | Land | Improvement |
|---|---|---|---|---|
| 2025 | $62 | $33,936 | $5,400 | $28,536 |
| 2024 | $62 | $33,936 | $5,400 | $28,536 |
| 2023 | $3,528 | $27,868 | $5,400 | $22,468 |
| 2022 | $291,715 | $27,868 | $5,400 | $22,468 |
| 2021 | $2,913 | $27,868 | $5,400 | $22,468 |
| 2020 | $2,911 | $27,868 | $5,400 | $22,468 |
| 2019 | $3,988 | $27,513 | $5,400 | $22,113 |
| 2018 | $3,994 | $27,513 | $5,400 | $22,113 |
| 2017 | $4,056 | $27,513 | $5,400 | $22,113 |
| 2016 | $4,086 | $27,513 | $5,400 | $22,113 |
| 2015 | $2,786 | $25,164 | $5,400 | $19,764 |
| 2014 | $2,879 | $25,164 | $5,400 | $19,764 |
| 2013 | -- | $5,400 | $5,400 | $0 |
Source: Public Records
Map
Nearby Homes
Your Personal Tour Guide
Ask me questions while you tour the home.