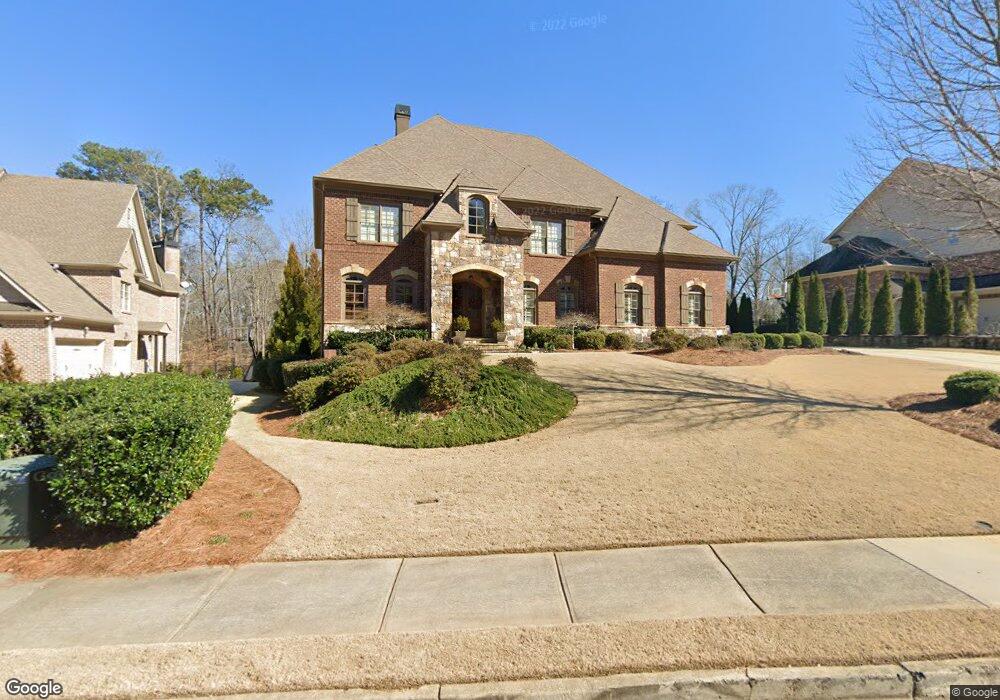
115 Dove Ct Roswell, GA 30075
Estimated Value: $1,268,000 - $2,285,000
6
Beds
7
Baths
5,781
Sq Ft
$278/Sq Ft
Est. Value
About This Home
This home is located at 115 Dove Ct, Roswell, GA 30075 and is currently estimated at $1,606,495, approximately $277 per square foot. 115 Dove Ct is a home located in Fulton County with nearby schools including Roswell North Elementary School, Crabapple Middle School, and High Meadows School.
Ownership History
Date
Name
Owned For
Owner Type
Purchase Details
Closed on
Jul 23, 2010
Sold by
Putre Kelly G
Bought by
Lumsden Ryan T and Lumsden Gretchen A
Current Estimated Value
Home Financials for this Owner
Home Financials are based on the most recent Mortgage that was taken out on this home.
Original Mortgage
$250,000
Outstanding Balance
$166,294
Interest Rate
4.74%
Mortgage Type
New Conventional
Estimated Equity
$1,440,201
Purchase Details
Closed on
Sep 16, 2009
Sold by
Hsbc Mtg Svcs Inc
Bought by
Glynn Erin
Home Financials for this Owner
Home Financials are based on the most recent Mortgage that was taken out on this home.
Original Mortgage
$91,120
Interest Rate
5.11%
Mortgage Type
New Conventional
Purchase Details
Closed on
May 5, 2009
Sold by
Graham Albert
Bought by
Hsbc Mortgage Services Inc
Purchase Details
Closed on
Dec 4, 2007
Sold by
Webco Builders Inc
Bought by
Putre Kelly G
Create a Home Valuation Report for This Property
The Home Valuation Report is an in-depth analysis detailing your home's value as well as a comparison with similar homes in the area
Home Values in the Area
Average Home Value in this Area
Purchase History
| Date | Buyer | Sale Price | Title Company |
|---|---|---|---|
| Lumsden Ryan T | $850,000 | -- | |
| Glynn Erin | $113,900 | -- | |
| Hsbc Mortgage Services Inc | $115,000 | -- | |
| Putre Kelly G | $962,600 | -- |
Source: Public Records
Mortgage History
| Date | Status | Borrower | Loan Amount |
|---|---|---|---|
| Open | Lumsden Ryan T | $250,000 | |
| Previous Owner | Glynn Erin | $91,120 |
Source: Public Records
Tax History Compared to Growth
Tax History
| Year | Tax Paid | Tax Assessment Tax Assessment Total Assessment is a certain percentage of the fair market value that is determined by local assessors to be the total taxable value of land and additions on the property. | Land | Improvement |
|---|---|---|---|---|
| 2025 | $1,170 | $456,000 | $83,400 | $372,600 |
| 2023 | $6,670 | $236,320 | $47,240 | $189,080 |
| 2022 | $5,830 | $236,320 | $47,240 | $189,080 |
| 2021 | $6,884 | $229,440 | $45,880 | $183,560 |
| 2020 | $6,987 | $226,720 | $45,320 | $181,400 |
| 2019 | $1,081 | $222,720 | $44,520 | $178,200 |
| 2018 | $5,797 | $217,480 | $43,480 | $174,000 |
| 2017 | $5,753 | $209,120 | $41,800 | $167,320 |
| 2016 | $5,752 | $209,120 | $41,800 | $167,320 |
| 2015 | $6,916 | $209,120 | $41,800 | $167,320 |
| 2014 | $6,020 | $209,120 | $41,800 | $167,320 |
Source: Public Records
Map
Nearby Homes
- 9705 Coleman Rd
- 130 Farm Hill Cir
- 657 Willeo Rd
- 545 Longleaf Dr Unit 1
- 145 Grayton Ln
- 340 Farm Path Unit 2
- 420 Longleaf Dr
- 135 Grayton Ln
- 175 Grayton Ln
- 325 Farm Trace
- 445 Longleaf Dr
- 830 Willeo Rd
- 9650 Coleman Rd
- 300 Farm Track Unit 3
- 9480 Coleman Rd
- 605 Ga 120 Hwy
- 2130 Federal Rd Unit II
- 9760 Loblolly Ln
- 105 Dove Ct
- 125 Dove Ct
- 595 Periwinkle Dr Unit 1
- 135 Dove Ct
- 110 Dove Ct
- 145 Dove Ct
- 600 Periwinkle Dr
- 120 Dove Ct
- 9745 Coleman Rd Unit 1
- 130 Dove Ct
- 140 Dove Ct
- 0 Coleman Rd Unit 8037302
- 0 Coleman Rd Unit 8715174
- 0 Coleman Rd Unit 8686950
- 0 Coleman Rd Unit 8602774
- 0 Coleman Rd Unit 8373847
- 0 Coleman Rd Unit 8223815
- 0 Coleman Rd Unit 8035228
- 0 Coleman Rd Unit 8647458
- 0 Coleman Rd Unit 8006356