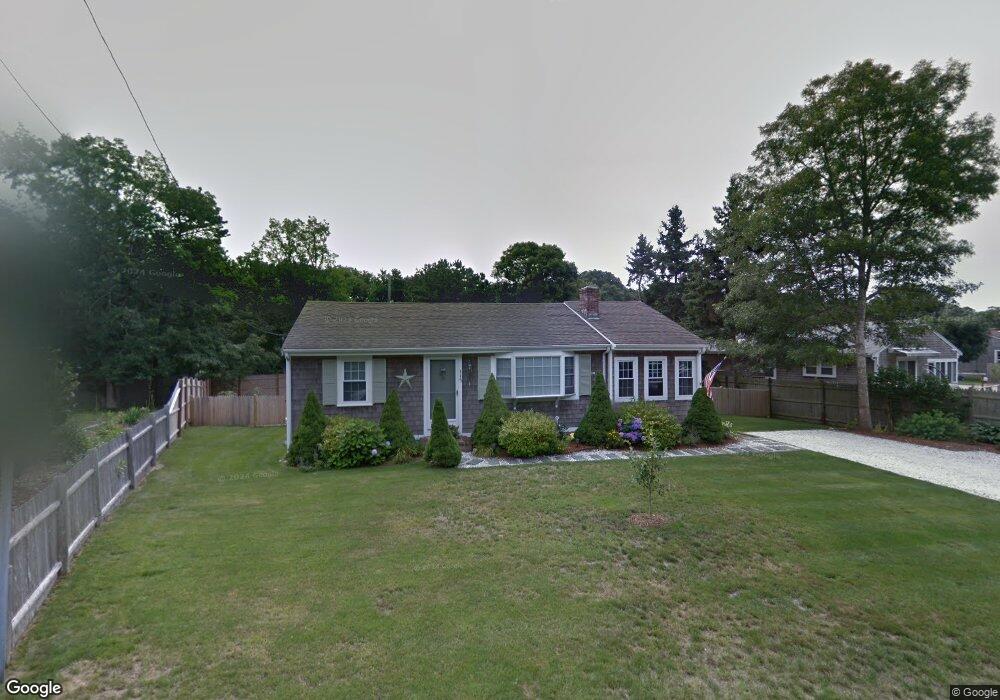
115 Duck Pond Road Extension South Dennis, MA 02660
South Dennis NeighborhoodEstimated Value: $581,000 - $716,052
3
Beds
1
Bath
800
Sq Ft
$813/Sq Ft
Est. Value
About This Home
This home is located at 115 Duck Pond Road Extension, South Dennis, MA 02660 and is currently estimated at $650,513, approximately $813 per square foot. 115 Duck Pond Road Extension is a home located in Barnstable County with nearby schools including Dennis-Yarmouth Regional High School and St. Pius X. School.
Ownership History
Date
Name
Owned For
Owner Type
Purchase Details
Closed on
Mar 2, 2023
Sold by
Jennings Thomas J
Bought by
Jennings Thomas J and Jennings Shannon
Current Estimated Value
Purchase Details
Closed on
Feb 24, 2017
Sold by
Jennings Thomas J and Jennings Meghann
Bought by
Jennings Thomas J
Purchase Details
Closed on
Dec 20, 2013
Sold by
Jackowitz Mark E and Jackowitz Julie A
Bought by
Jennings Thomas J and Jennings Meghann
Purchase Details
Closed on
May 3, 2004
Sold by
Spalt James
Bought by
Jackowitz Julie A and Jackowitz Mark E
Home Financials for this Owner
Home Financials are based on the most recent Mortgage that was taken out on this home.
Original Mortgage
$170,000
Interest Rate
5.36%
Mortgage Type
Purchase Money Mortgage
Purchase Details
Closed on
Oct 20, 2003
Sold by
Sylvia Anne D
Bought by
Spalt James
Create a Home Valuation Report for This Property
The Home Valuation Report is an in-depth analysis detailing your home's value as well as a comparison with similar homes in the area
Home Values in the Area
Average Home Value in this Area
Purchase History
| Date | Buyer | Sale Price | Title Company |
|---|---|---|---|
| Jennings Thomas J | -- | None Available | |
| Jennings Thomas J | -- | -- | |
| Jennings Thomas J | $290,000 | -- | |
| Jackowitz Julie A | $270,000 | -- | |
| Spalt James | $165,000 | -- |
Source: Public Records
Mortgage History
| Date | Status | Borrower | Loan Amount |
|---|---|---|---|
| Previous Owner | Jackowitz Julie A | $170,000 |
Source: Public Records
Tax History Compared to Growth
Tax History
| Year | Tax Paid | Tax Assessment Tax Assessment Total Assessment is a certain percentage of the fair market value that is determined by local assessors to be the total taxable value of land and additions on the property. | Land | Improvement |
|---|---|---|---|---|
| 2025 | $2,897 | $669,000 | $127,000 | $542,000 |
| 2024 | $2,846 | $648,400 | $129,300 | $519,100 |
| 2023 | $2,753 | $589,500 | $117,500 | $472,000 |
| 2022 | $2,611 | $466,300 | $117,700 | $348,600 |
| 2021 | $2,388 | $396,000 | $103,800 | $292,200 |
| 2020 | $5,384 | $369,000 | $103,800 | $265,200 |
| 2019 | $2,082 | $337,400 | $101,800 | $235,600 |
| 2018 | $1,954 | $308,200 | $96,900 | $211,300 |
| 2017 | $5,224 | $301,400 | $96,900 | $204,500 |
| 2016 | $1,803 | $276,100 | $107,700 | $168,400 |
| 2015 | $1,742 | $272,200 | $107,700 | $164,500 |
| 2014 | $1,184 | $186,500 | $77,500 | $109,000 |
Source: Public Records
Map
Nearby Homes
- 3 Jennifer Ln
- 29 Highland St
- 31 Duck Pond Rd
- 401 Main St Unit 201
- 401 Main St Unit 101
- 116 Searsville Rd
- 171 Searsville Rd
- 360 Center St
- 293 Main St
- 293 Main St
- 295 Main St
- 20 Sycamore Ln
- 37 Cyprus Rd
- 6 Hawthorn St
- 37 Cyprus Rd
- 0 Ash Ct
- 20 Aunt Debbys Rd
- 62 Old Fish House Rd
- 537 Depot St
- 1 Norseman Dr
- 115 Duck Pond Road Extension
- 115 Duck Pond Road Extension
- 119 Duck Pond Road Extension
- 4 Lisamy Dr
- 40 Leonard Rd
- 123 Duck Pond Road Extension
- 123 Duck Pond Road Extension
- 123 Duck Pond Road Extension
- 124 Duck Pond Road Extension
- 31 Leonard Rd
- 28 Leonard Rd
- 118 Duck Pond Road Extension
- 105 Duck Pond Road Extension
- 15 Wharton Way
- 127 Duck Pond Road Extension
- 127 Duck Pond Road Extension
- 25 Leonard Rd
- 126 Duck Pond Road Extension
- 110 Duck Pond Road Extension
- 12 Benjamin Rd