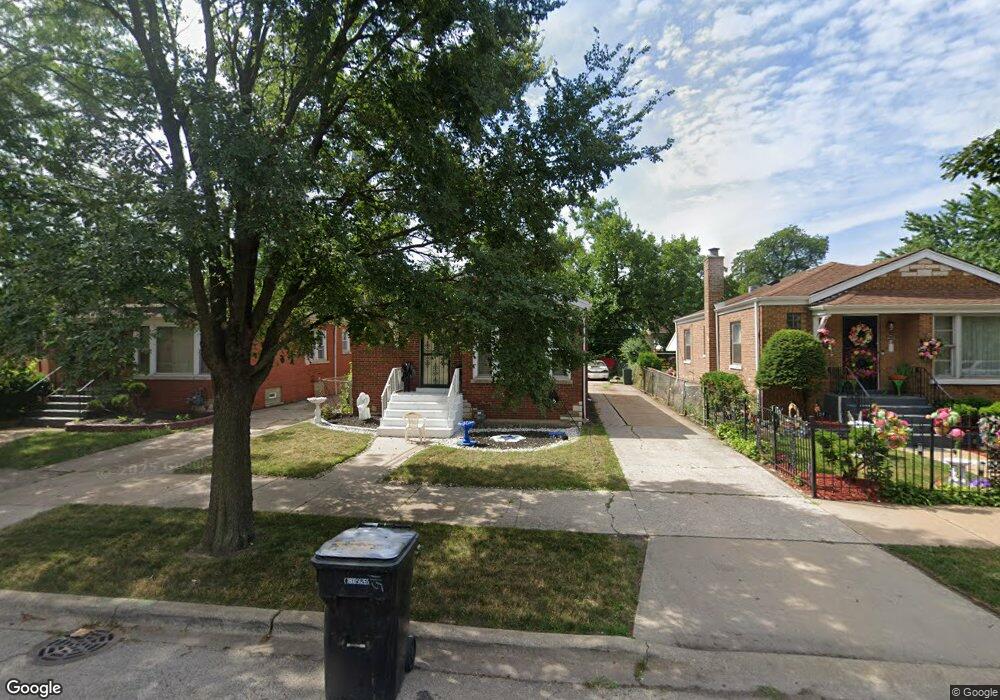
115 E 124th St Chicago, IL 60628
West Pullman NeighborhoodEstimated Value: $155,000 - $228,845
3
Beds
2
Baths
900
Sq Ft
$210/Sq Ft
Est. Value
About This Home
This home is located at 115 E 124th St, Chicago, IL 60628 and is currently estimated at $188,961, approximately $209 per square foot. 115 E 124th St is a home located in Cook County with nearby schools including Gompers Elementary Fine Arts Opt School, Fenger Academy High School, and Chicago Collegiate Charter School.
Ownership History
Date
Name
Owned For
Owner Type
Purchase Details
Closed on
Dec 28, 2020
Sold by
Community Initiatives Inc
Bought by
Paxwood Investments Llc
Current Estimated Value
Purchase Details
Closed on
Aug 20, 2020
Sold by
Fannie Mae
Bought by
Community Initiatives Inc
Purchase Details
Closed on
Mar 12, 2020
Sold by
Johnson Quiana L and Gildersleeve Sterling James
Bought by
Federal National Mortgage Associaton
Purchase Details
Closed on
May 15, 2006
Sold by
Bank One Na
Bought by
Johnson Quiana L
Home Financials for this Owner
Home Financials are based on the most recent Mortgage that was taken out on this home.
Original Mortgage
$138,000
Interest Rate
6.72%
Mortgage Type
Unknown
Purchase Details
Closed on
Feb 22, 2006
Sold by
Saulsberry Rubie
Bought by
Bank One Na
Purchase Details
Closed on
Feb 19, 2001
Sold by
Wright Annie H
Bought by
Salusberry Rubie and Salusberry Susan M
Home Financials for this Owner
Home Financials are based on the most recent Mortgage that was taken out on this home.
Original Mortgage
$73,600
Interest Rate
11.25%
Create a Home Valuation Report for This Property
The Home Valuation Report is an in-depth analysis detailing your home's value as well as a comparison with similar homes in the area
Home Values in the Area
Average Home Value in this Area
Purchase History
| Date | Buyer | Sale Price | Title Company |
|---|---|---|---|
| Paxwood Investments Llc | $85,000 | First American Title | |
| Community Initiatives Inc | $90,000 | First American Title | |
| Federal National Mortgage Associaton | -- | Attorney | |
| Johnson Quiana L | $138,000 | First American Title | |
| Bank One Na | -- | None Available | |
| Salusberry Rubie | $88,000 | First American Title |
Source: Public Records
Mortgage History
| Date | Status | Borrower | Loan Amount |
|---|---|---|---|
| Previous Owner | Johnson Quiana L | $138,000 | |
| Previous Owner | Salusberry Rubie | $73,600 | |
| Closed | Salusberry Rubie | $10,000 |
Source: Public Records
Tax History
| Year | Tax Paid | Tax Assessment Tax Assessment Total Assessment is a certain percentage of the fair market value that is determined by local assessors to be the total taxable value of land and additions on the property. | Land | Improvement |
|---|---|---|---|---|
| 2025 | $1,798 | $12,000 | $5,997 | $6,003 |
| 2024 | $1,798 | $12,000 | $5,997 | $6,003 |
| 2023 | $1,753 | $8,501 | $4,934 | $3,567 |
| 2022 | $1,753 | $8,501 | $4,934 | $3,567 |
| 2021 | $1,714 | $8,499 | $4,933 | $3,566 |
| 2020 | $1,253 | $8,711 | $2,788 | $5,923 |
| 2019 | $1,259 | $9,679 | $2,788 | $6,891 |
| 2018 | $1,236 | $9,679 | $2,788 | $6,891 |
| 2017 | $1,386 | $9,799 | $2,574 | $7,225 |
| 2016 | $1,466 | $9,799 | $2,574 | $7,225 |
| 2015 | $1,318 | $9,799 | $2,574 | $7,225 |
| 2014 | $1,131 | $8,651 | $2,145 | $6,506 |
| 2013 | $1,098 | $8,651 | $2,145 | $6,506 |
Source: Public Records
Map
Nearby Homes
- 12356 S Michigan Ave
- 12346 S Indiana Ave
- 12453 S State St
- 12326 S Indiana Ave
- 12432 S State St
- 12484 S Michigan Ave
- 53 W 123rd St
- 12549 S Michigan Ave
- 12205 S State St
- 15 E 126th St
- 141 W 124th St
- 12109 S Indiana Ave
- 12053 S Michigan Ave
- 12617 S Wentworth Ave
- 149 E 120th Place
- 12251 S Yale Ave
- 120 E 120th Place
- 12012 S Michigan Ave
- 12017 S Indiana Ave
- 321 E 120th Place
- 117 E 124th St
- 109 E 124th St
- 12411 S Michigan Ave
- 127 E 124th St
- 119 E 124th St
- 101 E 124th St
- 129 E 124th St
- 12415 S Michigan Ave
- 131 E 124th St
- 112 E 124th St
- 12423 S Michigan Ave
- 108 E 124th St
- 118 E 124th St Unit 120
- 104 E 124th St
- 135 E 124th St
- 126 E 124th St
- 12410 S Michigan Ave
- 130 E 124th St
- 137 E 124th St
- 12404 S Michigan Ave
Your Personal Tour Guide
Ask me questions while you tour the home.