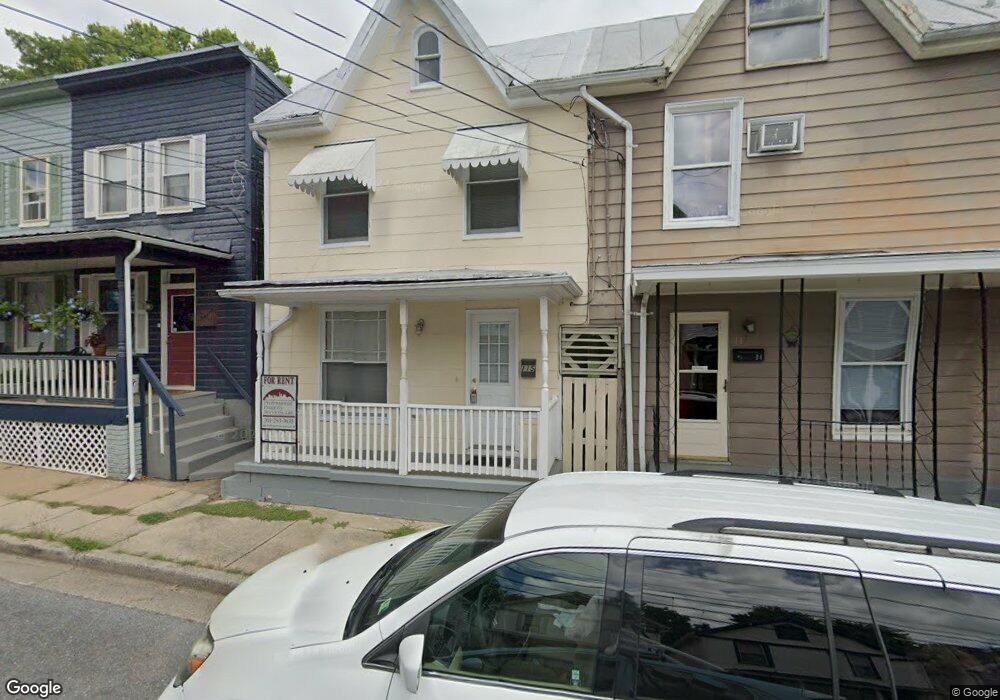
115 E 6th St Frederick, MD 21701
Downtown Frederick NeighborhoodEstimated Value: $338,892 - $375,000
Studio
3
Baths
1,232
Sq Ft
$288/Sq Ft
Est. Value
About This Home
This home is located at 115 E 6th St, Frederick, MD 21701 and is currently estimated at $354,223, approximately $287 per square foot. 115 E 6th St is a home located in Frederick County with nearby schools including North Frederick Elementary School, Gov. Thomas Johnson Middle School, and Gov. Thomas Johnson High School.
Ownership History
Date
Name
Owned For
Owner Type
Purchase Details
Closed on
Apr 2, 2015
Sold by
Wright Vaughan M and Wright Danae M
Bought by
Wright Danae M
Current Estimated Value
Purchase Details
Closed on
Oct 30, 2001
Sold by
Delashmutt James and Delashmutt Haruko
Bought by
Wright Vaughan M and Wright Danae M
Purchase Details
Closed on
May 4, 1984
Sold by
Eyler Carroll W and Eyler Theresa M
Bought by
Delashmutt James and Delashmutt Haruko
Home Financials for this Owner
Home Financials are based on the most recent Mortgage that was taken out on this home.
Original Mortgage
$32,000
Interest Rate
13.78%
Create a Home Valuation Report for This Property
The Home Valuation Report is an in-depth analysis detailing your home's value as well as a comparison with similar homes in the area
Home Values in the Area
Average Home Value in this Area
Purchase History
| Date | Buyer | Sale Price | Title Company |
|---|---|---|---|
| Wright Danae M | -- | None Available | |
| Wright Vaughan M | $40,000 | -- | |
| Delashmutt James | $36,000 | -- |
Source: Public Records
Mortgage History
| Date | Status | Borrower | Loan Amount |
|---|---|---|---|
| Previous Owner | Delashmutt James | $32,000 |
Source: Public Records
Tax History
| Year | Tax Paid | Tax Assessment Tax Assessment Total Assessment is a certain percentage of the fair market value that is determined by local assessors to be the total taxable value of land and additions on the property. | Land | Improvement |
|---|---|---|---|---|
| 2025 | $4,522 | $265,000 | $116,500 | $148,500 |
| 2024 | $4,522 | $241,900 | -- | -- |
| 2023 | $4,021 | $218,800 | $0 | $0 |
| 2022 | $3,561 | $195,700 | $87,300 | $108,400 |
| 2021 | $3,354 | $183,867 | $0 | $0 |
| 2020 | $3,131 | $172,033 | $0 | $0 |
| 2019 | $2,920 | $160,200 | $59,000 | $101,200 |
| 2018 | $2,932 | $159,433 | $0 | $0 |
| 2017 | $2,890 | $160,200 | $0 | $0 |
| 2016 | $2,977 | $157,900 | $0 | $0 |
| 2015 | $2,977 | $157,900 | $0 | $0 |
| 2014 | $2,977 | $157,900 | $0 | $0 |
Source: Public Records
Map
Nearby Homes
Your Personal Tour Guide
Ask me questions while you tour the home.