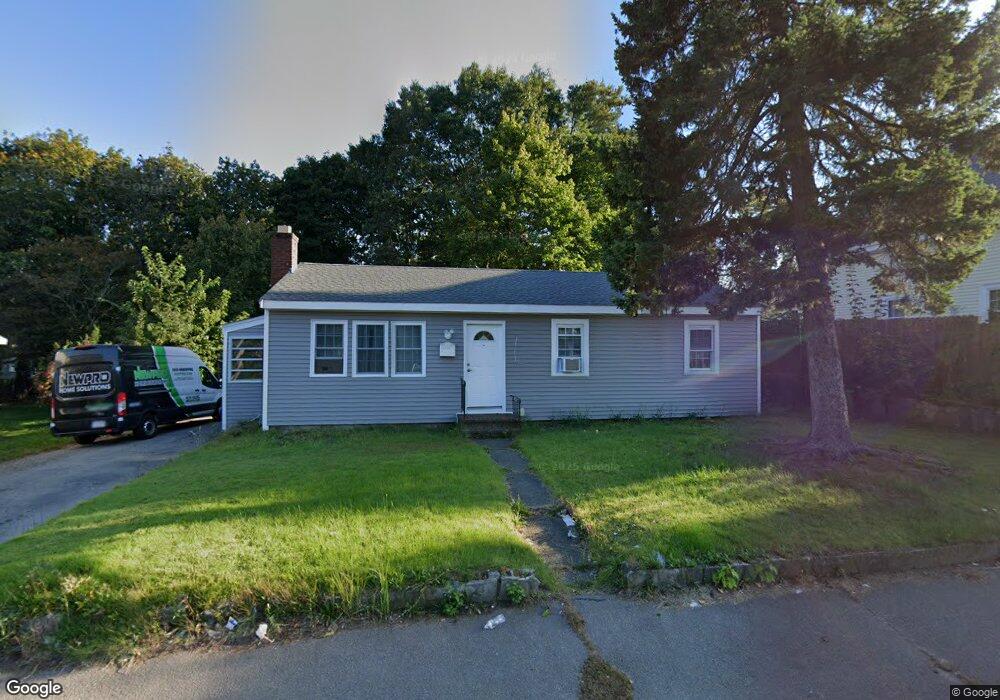
115 E Ashland St Brockton, MA 02302
Estimated Value: $415,000 - $456,854
3
Beds
1
Bath
960
Sq Ft
$464/Sq Ft
Est. Value
About This Home
This home is located at 115 E Ashland St, Brockton, MA 02302 and is currently estimated at $445,714, approximately $464 per square foot. 115 E Ashland St is a home located in Plymouth County with nearby schools including Brookfield Elementary School, Downey Elementary School, and Ashfield Middle School.
Ownership History
Date
Name
Owned For
Owner Type
Purchase Details
Closed on
Sep 22, 2006
Sold by
Citifinancial Mtg Co I and Integrated Asset Svcs
Bought by
Edeh Augustine I
Current Estimated Value
Home Financials for this Owner
Home Financials are based on the most recent Mortgage that was taken out on this home.
Original Mortgage
$197,600
Interest Rate
6.59%
Mortgage Type
Purchase Money Mortgage
Purchase Details
Closed on
Dec 5, 2005
Sold by
Cyrus Marveth
Bought by
Citifinancial Mtg Co I
Purchase Details
Closed on
Jun 16, 2003
Sold by
Striggles Matthew C and Striggles Gloria E
Bought by
Cyrus Marveth
Purchase Details
Closed on
Jul 16, 2001
Sold by
Michel Gesta Simeon and Michel Neptune
Bought by
Striggles Matthew C and Striggles Gloria E
Purchase Details
Closed on
Mar 31, 1994
Sold by
Worcester County Instn
Bought by
Clautaire Michael
Purchase Details
Closed on
Dec 20, 1993
Sold by
Webb John E and Webb Rose L
Bought by
Worc Cnty Inst Svgs
Create a Home Valuation Report for This Property
The Home Valuation Report is an in-depth analysis detailing your home's value as well as a comparison with similar homes in the area
Home Values in the Area
Average Home Value in this Area
Purchase History
| Date | Buyer | Sale Price | Title Company |
|---|---|---|---|
| Edeh Augustine I | $247,000 | -- | |
| Citifinancial Mtg Co I | $53,000 | -- | |
| Cyrus Marveth | $125,000 | -- | |
| Striggles Matthew C | $96,900 | -- | |
| Clautaire Michael | $50,000 | -- | |
| Clautaire Michael | $50,000 | -- | |
| Worc Cnty Inst Svgs | $44,800 | -- | |
| Worc Cnty Inst Svgs | $44,800 | -- |
Source: Public Records
Mortgage History
| Date | Status | Borrower | Loan Amount |
|---|---|---|---|
| Open | Worc Cnty Inst Svgs | $256,500 | |
| Closed | Worc Cnty Inst Svgs | $197,600 |
Source: Public Records
Tax History Compared to Growth
Tax History
| Year | Tax Paid | Tax Assessment Tax Assessment Total Assessment is a certain percentage of the fair market value that is determined by local assessors to be the total taxable value of land and additions on the property. | Land | Improvement |
|---|---|---|---|---|
| 2025 | $4,637 | $382,900 | $147,300 | $235,600 |
| 2024 | $4,595 | $382,300 | $147,300 | $235,000 |
| 2023 | $4,587 | $353,400 | $112,500 | $240,900 |
| 2022 | $4,164 | $298,100 | $102,300 | $195,800 |
| 2021 | $4,009 | $276,500 | $96,500 | $180,000 |
| 2020 | $3,807 | $251,300 | $92,400 | $158,900 |
| 2019 | $3,691 | $237,500 | $86,700 | $150,800 |
| 2018 | $3,339 | $207,900 | $86,700 | $121,200 |
| 2017 | $3,218 | $199,900 | $86,700 | $113,200 |
| 2016 | $3,026 | $174,300 | $82,800 | $91,500 |
| 2015 | $2,826 | $155,700 | $82,800 | $72,900 |
| 2014 | $2,923 | $161,200 | $82,800 | $78,400 |
Source: Public Records
Map
Nearby Homes
- 121 E Ashland St
- 109 E Ashland St
- 93 Emmet St Unit 2
- 93 Emmet St
- 127 E Ashland St
- 60 River St
- 81 Emmet St
- 85 Emmet St
- 85 Emmet St Unit 85
- 83 Emmet St
- 83 Emmet St Unit 83
- 52 River St
- 116 E Ashland St
- 133 E Ashland St
- 133 E Ashland St Unit 1
- 56 River St
- 97 E Ashland St
- 124 E Ashland St
- 95 E Ashland St
- 88 Emmet St