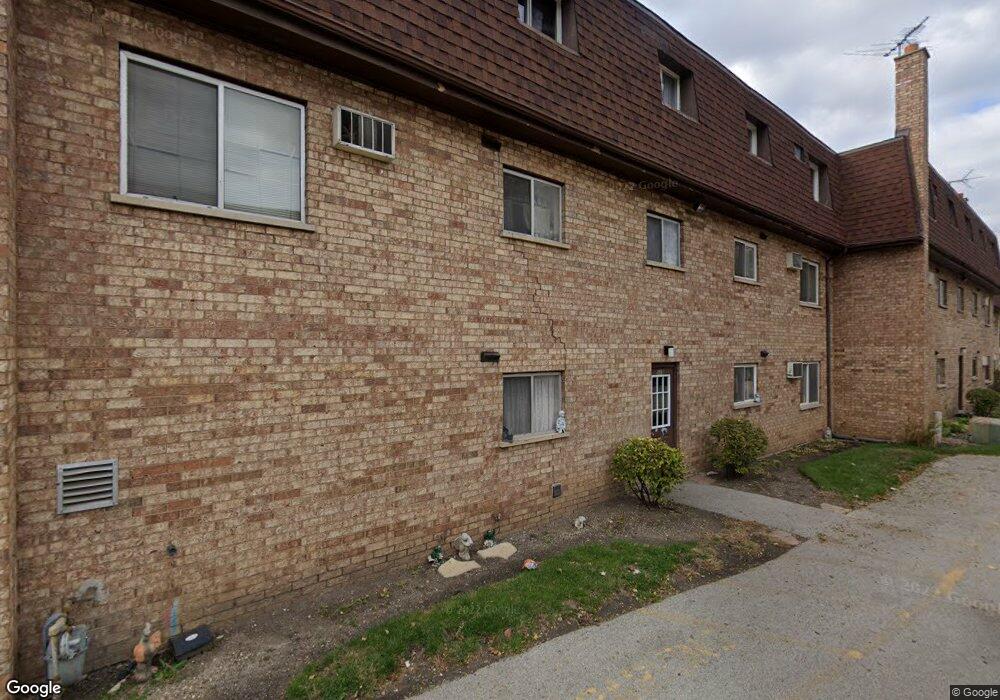
115 E Dundee Rd Unit C1N Wheeling, IL 60090
Estimated Value: $163,000 - $199,000
2
Beds
1
Bath
6,535
Sq Ft
$28/Sq Ft
Est. Value
About This Home
This home is located at 115 E Dundee Rd Unit C1N, Wheeling, IL 60090 and is currently estimated at $184,685, approximately $28 per square foot. 115 E Dundee Rd Unit C1N is a home located in Cook County with nearby schools including Walt Whitman Elementary School, Oliver W Holmes Middle School, and Wheeling High School.
Ownership History
Date
Name
Owned For
Owner Type
Purchase Details
Closed on
Oct 6, 2009
Sold by
Kipnis Dmitriy
Bought by
Shokodko Oleg and Shokodko Anna
Current Estimated Value
Purchase Details
Closed on
Dec 4, 2005
Sold by
Kipnis Irina and Kipnis Dmitriy
Bought by
Kipnis Dmitriy
Purchase Details
Closed on
Mar 22, 2004
Sold by
Wajda Andrzej
Bought by
Kipnis Dmitriy and Kipnis Irina
Home Financials for this Owner
Home Financials are based on the most recent Mortgage that was taken out on this home.
Original Mortgage
$130,950
Interest Rate
5.74%
Mortgage Type
Unknown
Purchase Details
Closed on
Jun 27, 2001
Sold by
Lasalle Bank National Assn
Bought by
Wajda Andrzej
Home Financials for this Owner
Home Financials are based on the most recent Mortgage that was taken out on this home.
Original Mortgage
$75,200
Interest Rate
6%
Create a Home Valuation Report for This Property
The Home Valuation Report is an in-depth analysis detailing your home's value as well as a comparison with similar homes in the area
Home Values in the Area
Average Home Value in this Area
Purchase History
| Date | Buyer | Sale Price | Title Company |
|---|---|---|---|
| Shokodko Oleg | $60,500 | First American Title Ins Co | |
| Kipnis Dmitriy | -- | None Available | |
| Kipnis Dmitriy | $135,000 | Heritage Title Company | |
| Wajda Andrzej | $94,500 | -- |
Source: Public Records
Mortgage History
| Date | Status | Borrower | Loan Amount |
|---|---|---|---|
| Previous Owner | Kipnis Dmitriy | $130,950 | |
| Previous Owner | Wajda Andrzej | $75,200 |
Source: Public Records
Tax History
| Year | Tax Paid | Tax Assessment Tax Assessment Total Assessment is a certain percentage of the fair market value that is determined by local assessors to be the total taxable value of land and additions on the property. | Land | Improvement |
|---|---|---|---|---|
| 2025 | $4,391 | $12,092 | $428 | $11,664 |
| 2024 | $4,391 | $13,105 | $345 | $12,760 |
| 2023 | $4,188 | $13,104 | $345 | $12,759 |
| 2022 | $4,188 | $13,104 | $345 | $12,759 |
| 2021 | $2,262 | $6,106 | $273 | $5,833 |
| 2020 | $2,203 | $6,106 | $273 | $5,833 |
| 2019 | $2,247 | $6,856 | $273 | $6,583 |
| 2018 | $2,089 | $5,724 | $237 | $5,487 |
| 2017 | $2,046 | $5,724 | $237 | $5,487 |
| 2016 | $1,910 | $5,724 | $237 | $5,487 |
| 2015 | $684 | $4,543 | $201 | $4,342 |
| 2014 | $686 | $4,543 | $201 | $4,342 |
| 2013 | $614 | $4,543 | $201 | $4,342 |
Source: Public Records
Map
Nearby Homes
- 100 Deborah Ln Unit B26
- 100 Deborah Ln Unit 16A
- 155 Lilac Ln
- 156 Wille Ave
- 190 N Milwaukee Ave Unit 3604
- 121 Commons Ct Unit 21
- 302 Linden Ln
- 246 Shadowbend Dr
- 292 Shadowbend Dr Unit 3C
- 372 Nancy Ln
- 325 Shadowbend Dr Unit 3B
- 241 S Milwaukee Ave
- 60 Grey Wolf Dr
- 216 W Jeffery Ave Unit 2
- 454 Stone Place
- 286 Prairie View Ln Unit 286
- 45 Prairie Park Dr Unit 501
- 437 Maple Dr
- 40 Prairie Park Dr Unit 608
- 456 Harmony Dr
- 115 E Dundee Rd Unit 3S
- 115 E Dundee Rd Unit C3S
- 115 E Dundee Rd Unit C1S
- 115 E Dundee Rd Unit C3N
- 115 E Dundee Rd Unit C2S
- 115 E Dundee Rd Unit C2N
- 115 E Dundee Rd Unit 1S
- 115 E Dundee Rd Unit 3N
- 115 E Dundee Rd Unit 2N
- 119 E Dundee Rd Unit B1S
- 119 E Dundee Rd Unit B3S
- 119 E Dundee Rd Unit B2N
- 119 E Dundee Rd Unit B3N
- 119 E Dundee Rd Unit B1N
- 119 E Dundee Rd Unit B2S
- 119 E Dundee Rd Unit 3N
- 119 E Dundee Rd Unit 3S
- 111 E Dundee Rd Unit D1E
- 111 E Dundee Rd Unit D2W
- 111 E Dundee Rd Unit D1W
Your Personal Tour Guide
Ask me questions while you tour the home.