Estimated Value: $77,000 - $87,000
3
Beds
2
Baths
1,929
Sq Ft
$44/Sq Ft
Est. Value
About This Home
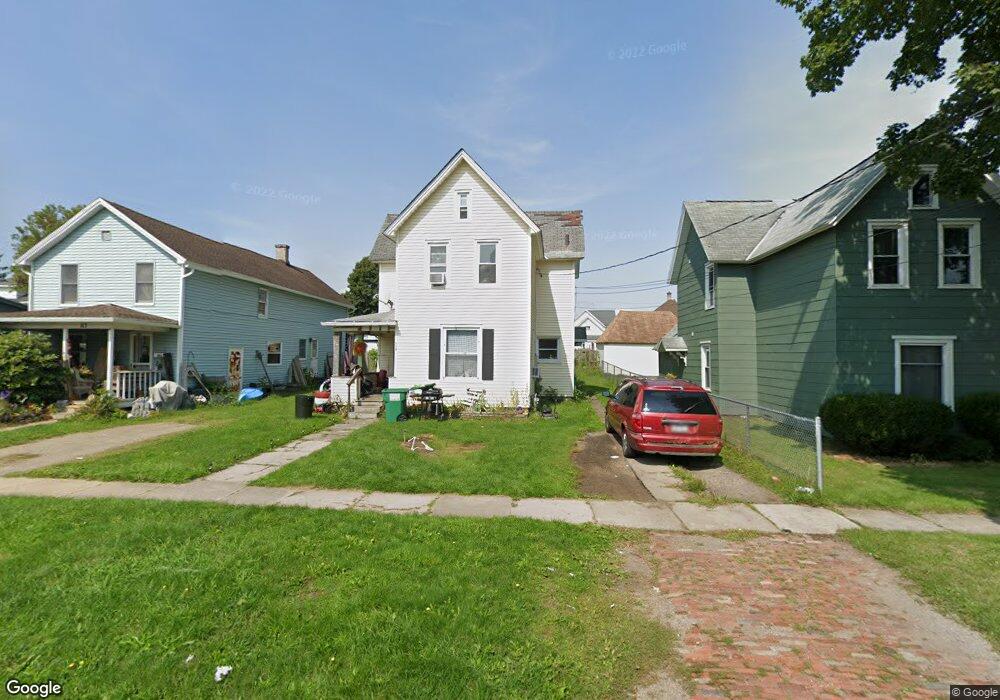
This home is located at 115 E Elm St, Olean, NY 14760 and is currently estimated at $84,318, approximately $43 per square foot. 115 E Elm St is a home located in Cattaraugus County with nearby schools including Olean Intermediate-Middle School, Olean Senior High School, and New Life Christian School.
Ownership History
Date
Name
Owned For
Owner Type
Purchase Details
Closed on
May 17, 2010
Sold by
West John
Bought by
Foster Edward
Current Estimated Value
Home Financials for this Owner
Home Financials are based on the most recent Mortgage that was taken out on this home.
Original Mortgage
$28,000
Interest Rate
5.11%
Mortgage Type
Purchase Money Mortgage
Purchase Details
Closed on
Apr 23, 2002
Sold by
Kramer Constance L
Bought by
West John A
Purchase Details
Closed on
Apr 22, 2002
Sold by
Kramer Constance L
Bought by
West John A
Create a Home Valuation Report for This Property
The Home Valuation Report is an in-depth analysis detailing your home's value as well as a comparison with similar homes in the area
Home Values in the Area
Average Home Value in this Area
Purchase History
| Date | Buyer | Sale Price | Title Company |
|---|---|---|---|
| Foster Edward | $35,000 | Daniel Palumbo | |
| West John A | $30,000 | Daniel R Palumbo | |
| West John A | $30,000 | Daniel R Palumbo |
Source: Public Records
Mortgage History
| Date | Status | Borrower | Loan Amount |
|---|---|---|---|
| Closed | Foster Edward | $28,000 |
Source: Public Records
Tax History
| Year | Tax Paid | Tax Assessment Tax Assessment Total Assessment is a certain percentage of the fair market value that is determined by local assessors to be the total taxable value of land and additions on the property. | Land | Improvement |
|---|---|---|---|---|
| 2025 | $2,643 | $41,800 | $4,400 | $37,400 |
| 2024 | $2,643 | $41,800 | $4,400 | $37,400 |
| 2023 | $1,574 | $41,800 | $4,400 | $37,400 |
| 2022 | $1,596 | $41,800 | $4,400 | $37,400 |
| 2021 | $1,643 | $41,800 | $4,400 | $37,400 |
| 2020 | $3,693 | $41,800 | $4,400 | $37,400 |
| 2019 | $747 | $41,800 | $4,400 | $37,400 |
| 2018 | $4,131 | $41,800 | $4,400 | $37,400 |
| 2017 | $3,579 | $41,800 | $4,400 | $37,400 |
| 2016 | $3,676 | $41,800 | $4,400 | $37,400 |
| 2015 | -- | $49,900 | $4,400 | $45,500 |
| 2014 | -- | $49,900 | $4,400 | $45,500 |
Source: Public Records
Map
Nearby Homes
Your Personal Tour Guide
Ask me questions while you tour the home.