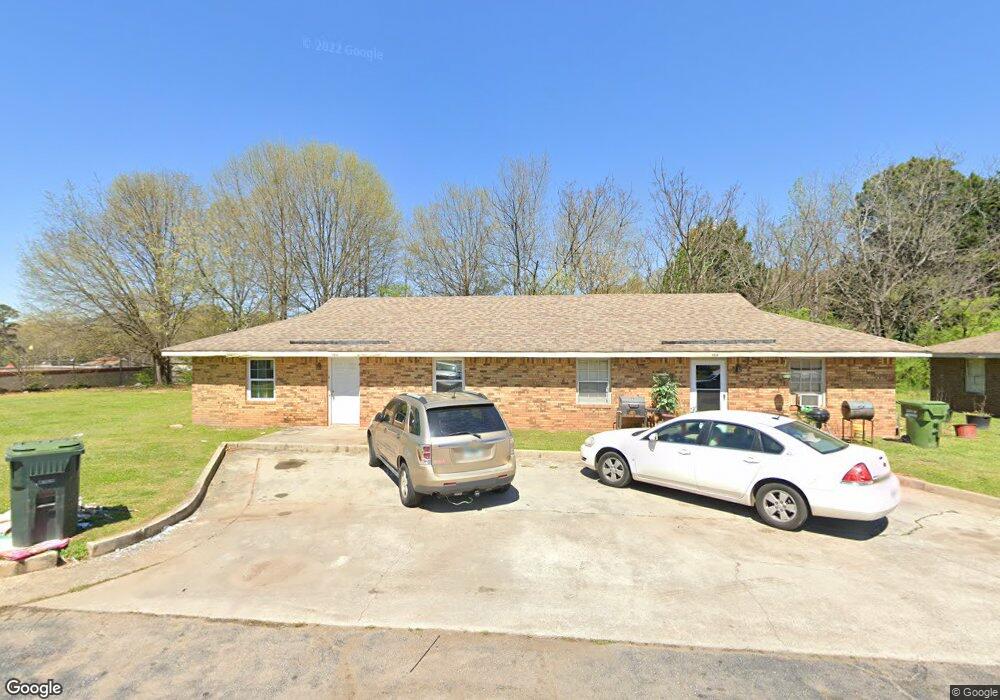
115 E Fambrough St Monroe, GA 30655
Estimated Value: $319,000 - $1,728,000
--
Bed
2
Baths
1,943
Sq Ft
$636/Sq Ft
Est. Value
About This Home
This home is located at 115 E Fambrough St, Monroe, GA 30655 and is currently estimated at $1,236,350, approximately $636 per square foot. 115 E Fambrough St is a home with nearby schools including Atha Road Elementary School, Youth Middle School, and Walnut Grove High School.
Ownership History
Date
Name
Owned For
Owner Type
Purchase Details
Closed on
Jul 18, 2019
Sold by
Briarfield East Llc
Bought by
Pinehurst Homes Llc
Current Estimated Value
Purchase Details
Closed on
Sep 7, 2010
Sold by
Synovus Bk
Bought by
Briarfield East Llc
Home Financials for this Owner
Home Financials are based on the most recent Mortgage that was taken out on this home.
Original Mortgage
$532,500
Interest Rate
4.6%
Mortgage Type
New Conventional
Purchase Details
Closed on
Jan 17, 2008
Sold by
Prather David A
Bought by
Rockdale Commons Inc
Purchase Details
Closed on
Feb 22, 2003
Sold by
Harter Mitch
Bought by
Prather David A
Create a Home Valuation Report for This Property
The Home Valuation Report is an in-depth analysis detailing your home's value as well as a comparison with similar homes in the area
Home Values in the Area
Average Home Value in this Area
Purchase History
| Date | Buyer | Sale Price | Title Company |
|---|---|---|---|
| Pinehurst Homes Llc | -- | -- | |
| Briarfield East Llc | $600,000 | -- | |
| Rockdale Commons Inc | -- | -- | |
| Prather David A | -- | -- |
Source: Public Records
Mortgage History
| Date | Status | Borrower | Loan Amount |
|---|---|---|---|
| Previous Owner | Briarfield East Llc | $532,500 |
Source: Public Records
Tax History Compared to Growth
Tax History
| Year | Tax Paid | Tax Assessment Tax Assessment Total Assessment is a certain percentage of the fair market value that is determined by local assessors to be the total taxable value of land and additions on the property. | Land | Improvement |
|---|---|---|---|---|
| 2024 | $25,753 | $756,560 | $47,800 | $708,760 |
| 2023 | $26,242 | $750,560 | $47,800 | $702,760 |
| 2022 | $26,311 | $704,560 | $47,800 | $656,760 |
| 2021 | $24,061 | $622,560 | $47,800 | $574,760 |
| 2020 | $24,337 | $613,560 | $47,800 | $565,760 |
| 2019 | $22,342 | $558,040 | $50,320 | $507,720 |
| 2018 | $21,977 | $558,040 | $50,320 | $507,720 |
| 2017 | $23,387 | $558,040 | $50,320 | $507,720 |
| 2016 | $20,069 | $486,800 | $50,320 | $436,480 |
| 2015 | $14,981 | $357,040 | $50,320 | $306,720 |
| 2014 | $16,582 | $383,600 | $58,840 | $324,760 |
Source: Public Records
Map
Nearby Homes