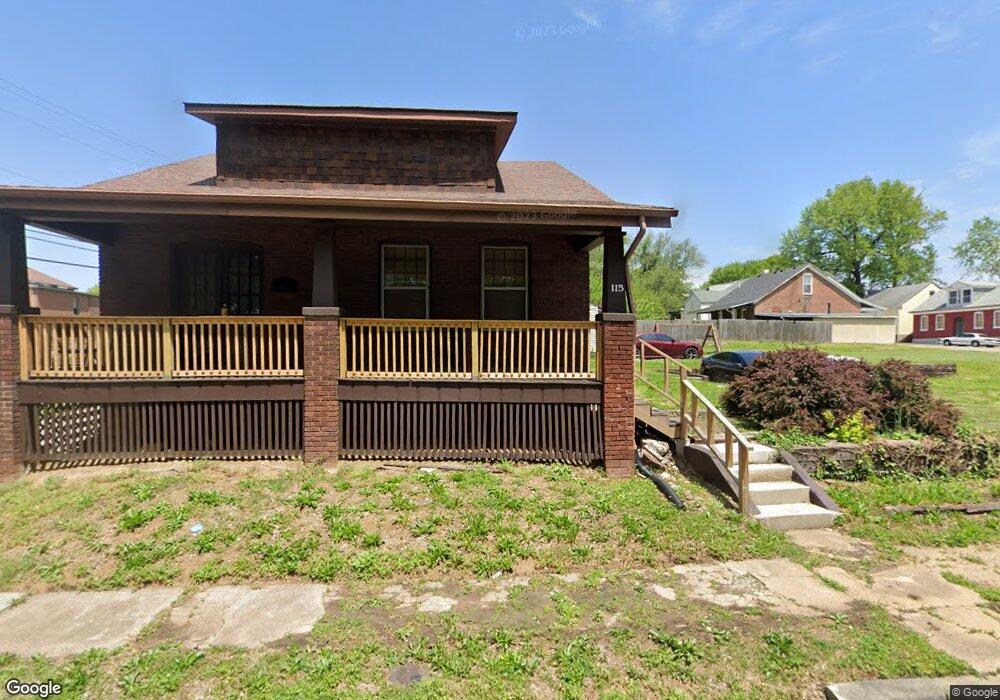
115 E Garfield St Belleville, IL 62220
Estimated Value: $53,000 - $114,000
--
Bed
--
Bath
1,131
Sq Ft
$85/Sq Ft
Est. Value
About This Home
This home is located at 115 E Garfield St, Belleville, IL 62220 and is currently estimated at $95,922, approximately $84 per square foot. 115 E Garfield St is a home located in St. Clair County with nearby schools including Westhaven Elementary School, Central Jr High School, and Notre Dame Academy of Belleville.
Ownership History
Date
Name
Owned For
Owner Type
Purchase Details
Closed on
Jul 31, 2015
Sold by
Riess Debra
Bought by
Riess Debra and Living Trust Of Jeffrey B Riess
Current Estimated Value
Purchase Details
Closed on
Dec 11, 2010
Sold by
Daubach Richard J and Daubach Janice M
Bought by
Riess Jeff
Home Financials for this Owner
Home Financials are based on the most recent Mortgage that was taken out on this home.
Original Mortgage
$26,208
Outstanding Balance
$17,324
Interest Rate
4.23%
Mortgage Type
Future Advance Clause Open End Mortgage
Estimated Equity
$78,598
Purchase Details
Closed on
Dec 18, 2009
Sold by
Daubach Richard and Daubach Janice
Bought by
West Floyd
Home Financials for this Owner
Home Financials are based on the most recent Mortgage that was taken out on this home.
Original Mortgage
$32,500
Interest Rate
4.96%
Mortgage Type
Seller Take Back
Create a Home Valuation Report for This Property
The Home Valuation Report is an in-depth analysis detailing your home's value as well as a comparison with similar homes in the area
Home Values in the Area
Average Home Value in this Area
Purchase History
| Date | Buyer | Sale Price | Title Company |
|---|---|---|---|
| Riess Debra | -- | Attorney | |
| Riess Jeff | $32,000 | Metro East Title Corporation | |
| West Floyd | $47,500 | None Available |
Source: Public Records
Mortgage History
| Date | Status | Borrower | Loan Amount |
|---|---|---|---|
| Open | Riess Jeff | $26,208 | |
| Previous Owner | West Floyd | $32,500 |
Source: Public Records
Tax History Compared to Growth
Tax History
| Year | Tax Paid | Tax Assessment Tax Assessment Total Assessment is a certain percentage of the fair market value that is determined by local assessors to be the total taxable value of land and additions on the property. | Land | Improvement |
|---|---|---|---|---|
| 2024 | $3,423 | $38,929 | $2,816 | $36,113 |
| 2023 | $1,688 | $17,983 | $2,795 | $15,188 |
| 2022 | $1,549 | $16,189 | $2,516 | $13,673 |
| 2021 | $1,492 | $14,966 | $2,326 | $12,640 |
| 2020 | $2,699 | $27,310 | $2,172 | $25,138 |
| 2019 | $2,392 | $23,086 | $2,176 | $20,910 |
| 2018 | $2,682 | $25,905 | $2,129 | $23,776 |
| 2017 | $2,661 | $25,723 | $2,114 | $23,609 |
| 2016 | $2,628 | $25,177 | $2,069 | $23,108 |
| 2014 | $897 | $9,699 | $4,679 | $5,020 |
| 2013 | $1,568 | $9,838 | $4,746 | $5,092 |
Source: Public Records
Map
Nearby Homes
- 401 S Jackson St
- 300 S Jackson St
- 222 S Jackson St
- 400 S Church St
- 310 S Church St
- 509 S Church St
- 415 S Charles St
- 508 Freeburg Ave
- 614 S Church St
- 208 S Charles St
- 600 S Charles St
- 411 S 1st St
- 523 Abend St
- 402 Abend St
- 414 S 2nd St
- 416 S 2nd St
- 122 Mascoutah Ave
- 412 E Mckinley St
- 904 S Jackson St
- 511 E Main St
- 317 S Jackson St
- 313 S Jackson St
- 322 S High St
- 320 S High St
- 309 S Jackson St
- 400 S High St
- 308 S High St
- 416 S High St
- 201 E Garfield St
- 201 E Garfield St Unit B
- 409 S Jackson St
- 305 S Jackson St
- 203 E Garfield St
- 400 S Jackson St
- 314 S Jackson St
- 303 S Jackson St
- 420 S High St
- 302 S High St
- 312 S Jackson St
- 117 E Monroe St