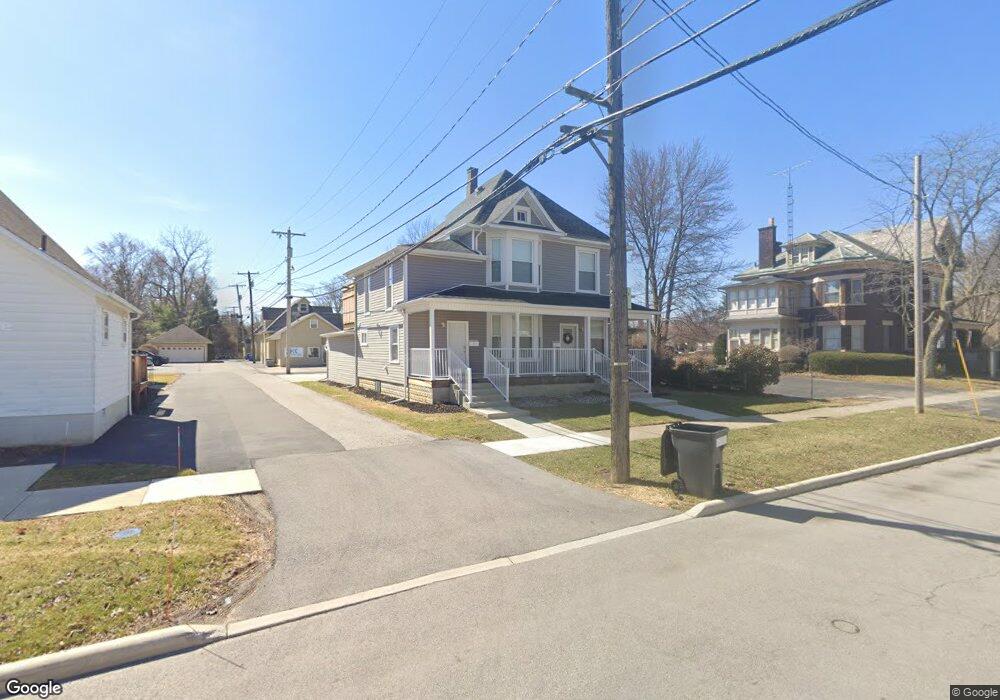
115 E Lima St Findlay, OH 45840
Estimated Value: $213,000 - $273,000
5
Beds
2
Baths
2,202
Sq Ft
$109/Sq Ft
Est. Value
About This Home
This home is located at 115 E Lima St, Findlay, OH 45840 and is currently estimated at $240,726, approximately $109 per square foot. 115 E Lima St is a home located in Hancock County with nearby schools including Lincoln Elementary School, Donnell Middle School, and Findlay High School.
Ownership History
Date
Name
Owned For
Owner Type
Purchase Details
Closed on
Jul 1, 2022
Sold by
Streicher Patrick J
Bought by
Miree Mozelle and Miree Evelyn L
Current Estimated Value
Home Financials for this Owner
Home Financials are based on the most recent Mortgage that was taken out on this home.
Original Mortgage
$25,000
Outstanding Balance
$16,882
Interest Rate
4.45%
Estimated Equity
$223,844
Purchase Details
Closed on
Nov 15, 2018
Sold by
Streicher Erika L
Bought by
Streicher Patrick J
Purchase Details
Closed on
Nov 9, 2015
Bought by
Streicher Erika L and Streicher Patrick J
Home Financials for this Owner
Home Financials are based on the most recent Mortgage that was taken out on this home.
Interest Rate
3.87%
Purchase Details
Closed on
Dec 13, 2013
Sold by
Ebersole Kurt L and Ebersole Jane A
Bought by
Lutheran Social Services Of Northwestern
Create a Home Valuation Report for This Property
The Home Valuation Report is an in-depth analysis detailing your home's value as well as a comparison with similar homes in the area
Home Values in the Area
Average Home Value in this Area
Purchase History
| Date | Buyer | Sale Price | Title Company |
|---|---|---|---|
| Miree Mozelle | $250,666 | Flag City Title | |
| Streicher Patrick J | -- | None Available | |
| Streicher Erika L | $69,000 | -- | |
| Lutheran Social Services Of Northwestern | -- | None Available |
Source: Public Records
Mortgage History
| Date | Status | Borrower | Loan Amount |
|---|---|---|---|
| Open | Miree Mozelle | $25,000 | |
| Open | Miree Mozelle | $200,000 | |
| Previous Owner | Streicher Erika L | -- |
Source: Public Records
Tax History
| Year | Tax Paid | Tax Assessment Tax Assessment Total Assessment is a certain percentage of the fair market value that is determined by local assessors to be the total taxable value of land and additions on the property. | Land | Improvement |
|---|---|---|---|---|
| 2024 | $2,237 | $62,150 | $4,970 | $57,180 |
| 2023 | $2,240 | $62,150 | $4,970 | $57,180 |
| 2022 | $2,232 | $62,150 | $4,970 | $57,180 |
| 2021 | $2,392 | $57,260 | $4,970 | $52,290 |
| 2020 | $2,391 | $57,260 | $4,970 | $52,290 |
| 2019 | $2,344 | $57,260 | $4,970 | $52,290 |
| 2018 | $2,046 | $45,810 | $3,970 | $41,840 |
| 2017 | $1,297 | $39,540 | $3,400 | $36,140 |
| 2016 | $18 | $39,540 | $3,400 | $36,140 |
| 2015 | $2,734 | $42,080 | $3,400 | $38,680 |
| 2014 | $2,734 | $42,080 | $3,400 | $38,680 |
| 2012 | $2,748 | $42,080 | $3,400 | $38,680 |
Source: Public Records
Map
Nearby Homes
- 829 Maple Ave
- 865 S Main St
- 216 1st St
- 815 Liberty St
- 514 Liberty St
- 845 Hurd Ave
- 412 Lima Ave
- 423 Elm St
- 860 Hurd Ave
- 1113 Hurd Ave
- 527 W Sandusky St
- 123 Glendale Ave
- 623 E Sandusky St
- 206 Greenlawn Ave
- 407 Washington St
- 324 W Mcpherson Ave
- 608 W Front St
- 807 W Main Cross St
- 213 Cherry St
- 125 Cherry St
- 115 E Lima St Unit Downstairs
- 801 S Main St Unit 801 s main
- 801 S Main St Unit B
- 801 S Main St Unit 6
- 801 S Main St
- 116 E Lima St
- 123 E Lima St
- 125 E Lima St
- 731 S Main St
- 120 E Lima St
- 128 E Lima St
- 725 S Main St
- 131 E Lima St
- 124 E Lima St
- 814 Beech Ave
- 820 Beech Ave
- 823 S Main St
- 132 E Lima St
- 826 Beech Ave
- 719 S Main St
Your Personal Tour Guide
Ask me questions while you tour the home.