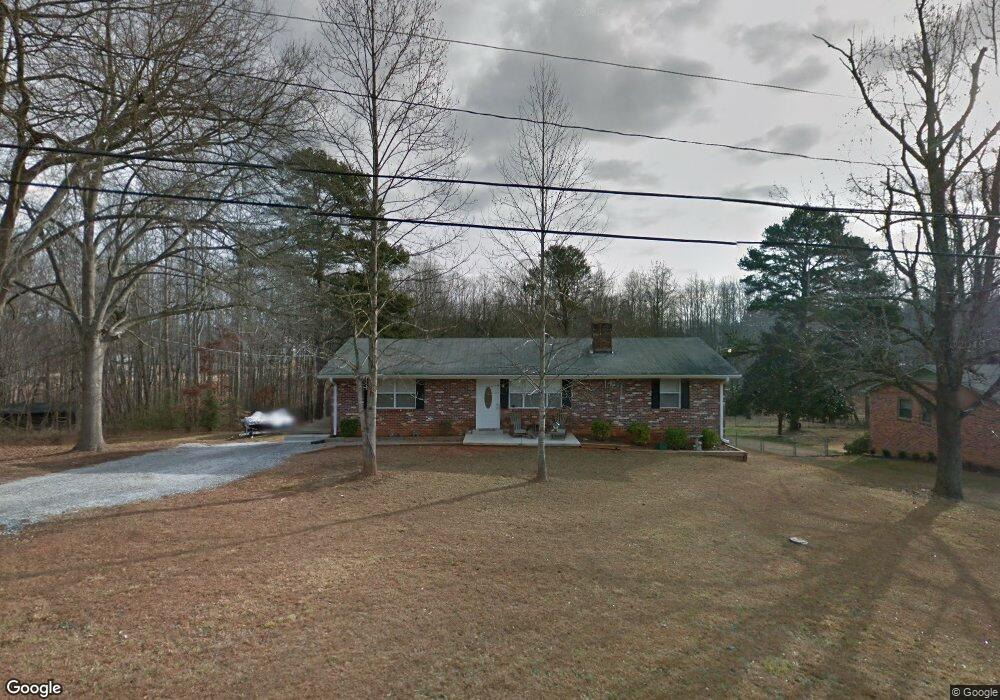
115 E Scenic Ln Travelers Rest, SC 29690
Estimated Value: $253,000 - $321,000
3
Beds
2
Baths
1,375
Sq Ft
$207/Sq Ft
Est. Value
About This Home
This home is located at 115 E Scenic Ln, Travelers Rest, SC 29690 and is currently estimated at $284,371, approximately $206 per square foot. 115 E Scenic Ln is a home located in Greenville County with nearby schools including Gateway Elementary School, Northwest Middle School, and Travelers Rest High School.
Ownership History
Date
Name
Owned For
Owner Type
Purchase Details
Closed on
Jun 4, 2012
Sold by
Pedersen Gary L and Pedersen Marjorie E
Bought by
Sexton Harold Lee and Sexton Stacey M
Current Estimated Value
Home Financials for this Owner
Home Financials are based on the most recent Mortgage that was taken out on this home.
Original Mortgage
$106,236
Outstanding Balance
$73,348
Interest Rate
3.75%
Mortgage Type
FHA
Estimated Equity
$211,023
Purchase Details
Closed on
Mar 18, 2011
Sold by
Federal Home Loan Mortgage Corporation
Bought by
Pedersen Gary L and Pedersen Marjorie E
Purchase Details
Closed on
Apr 27, 2010
Sold by
Campbell William W
Bought by
Federal Home Loan Mortgage Corp
Purchase Details
Closed on
Sep 23, 2002
Sold by
Campbell Sandra M
Bought by
Campbell William W
Purchase Details
Closed on
Sep 17, 2001
Sold by
Ellenburg Matthew A
Bought by
Campbell Sandra M
Purchase Details
Closed on
Dec 8, 2000
Sold by
Ngard Carole Moore
Bought by
Lenburg Matthew A
Create a Home Valuation Report for This Property
The Home Valuation Report is an in-depth analysis detailing your home's value as well as a comparison with similar homes in the area
Home Values in the Area
Average Home Value in this Area
Purchase History
| Date | Buyer | Sale Price | Title Company |
|---|---|---|---|
| Sexton Harold Lee | $109,000 | -- | |
| Pedersen Gary L | $50,000 | -- | |
| Federal Home Loan Mortgage Corp | $2,500 | -- | |
| Campbell William W | -- | -- | |
| Campbell Sandra M | $81,000 | -- | |
| Lenburg Matthew A | $68,000 | -- |
Source: Public Records
Mortgage History
| Date | Status | Borrower | Loan Amount |
|---|---|---|---|
| Open | Sexton Harold Lee | $106,236 |
Source: Public Records
Tax History Compared to Growth
Tax History
| Year | Tax Paid | Tax Assessment Tax Assessment Total Assessment is a certain percentage of the fair market value that is determined by local assessors to be the total taxable value of land and additions on the property. | Land | Improvement |
|---|---|---|---|---|
| 2024 | $866 | $5,200 | $1,380 | $3,820 |
| 2023 | $866 | $5,200 | $1,380 | $3,820 |
| 2022 | $843 | $5,200 | $1,380 | $3,820 |
| 2021 | $829 | $5,200 | $1,380 | $3,820 |
| 2020 | $773 | $4,520 | $920 | $3,600 |
| 2019 | $768 | $4,520 | $920 | $3,600 |
| 2018 | $787 | $4,520 | $920 | $3,600 |
| 2017 | $782 | $4,520 | $920 | $3,600 |
| 2016 | $742 | $112,980 | $22,930 | $90,050 |
| 2015 | $725 | $112,980 | $22,930 | $90,050 |
| 2014 | $632 | $98,250 | $23,500 | $74,750 |
Source: Public Records
Map
Nearby Homes
- 9 Wild Fern Ct
- 1 Wild Fern Ct
- 210 Brayton Ct
- 12 Halowell Ln
- 4 Halowell Ln
- 11 Halowell Ln
- 3 Halowell Ln
- 112 Halowell Ln
- 110 Colony Rd
- 120 Halowell Ln
- 5705 State Park Rd
- 11 Echo Dr
- 207 Grandview Cir
- 6206 State Park Rd
- 129 Shager Place
- 24 Gaskins Trail
- 22 Gaskins Trail
- 4 Gaskins Trail
- 400 Trillium Creek Ct
- 100 Pinelands Place
- 117 E Scenic Ln
- 121 E Scenic Ln
- 111 E Scenic Ln
- 114 E Scenic Ln
- 112 E Scenic Ln
- 118 E Scenic Ln
- 125 E Scenic Ln
- 120 E Scenic Ln
- 110 E Scenic Ln
- 122 E Scenic Ln
- 5 W Scenic Dr
- 3 W Scenic Dr
- 1 W Scenic Dr
- 101 W Scenic Dr
- 111 W Scenic Dr
- 103 W Scenic Dr
- 233 Meadow Rose Dr
- 201 E Scenic Ln
- 237 Meadow Rose Dr
- 225 Meadow Rose Dr