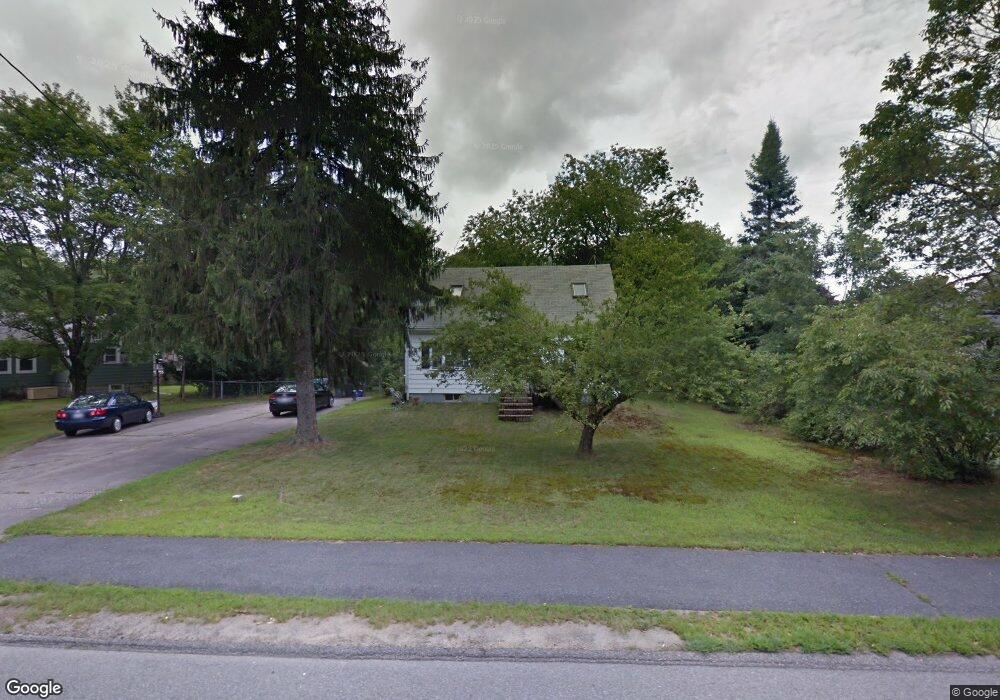
115 East St Foxboro, MA 02035
Estimated Value: $562,973 - $595,000
3
Beds
3
Baths
1,152
Sq Ft
$502/Sq Ft
Est. Value
About This Home
This home is located at 115 East St, Foxboro, MA 02035 and is currently estimated at $577,743, approximately $501 per square foot. 115 East St is a home located in Norfolk County with nearby schools including Foxborough High School, St Mary's Catholic School, and Hands-On-Montessori School.
Ownership History
Date
Name
Owned For
Owner Type
Purchase Details
Closed on
Dec 17, 1992
Sold by
Brooks Brenda F
Bought by
Roche Dennis and Roche Cheryl L
Current Estimated Value
Home Financials for this Owner
Home Financials are based on the most recent Mortgage that was taken out on this home.
Original Mortgage
$112,527
Interest Rate
8.3%
Mortgage Type
Purchase Money Mortgage
Create a Home Valuation Report for This Property
The Home Valuation Report is an in-depth analysis detailing your home's value as well as a comparison with similar homes in the area
Home Values in the Area
Average Home Value in this Area
Purchase History
| Date | Buyer | Sale Price | Title Company |
|---|---|---|---|
| Roche Dennis | $115,000 | -- |
Source: Public Records
Mortgage History
| Date | Status | Borrower | Loan Amount |
|---|---|---|---|
| Open | Roche Dennis | $69,000 | |
| Closed | Roche Dennis | $23,200 | |
| Closed | Roche Dennis | $112,527 |
Source: Public Records
Tax History Compared to Growth
Tax History
| Year | Tax Paid | Tax Assessment Tax Assessment Total Assessment is a certain percentage of the fair market value that is determined by local assessors to be the total taxable value of land and additions on the property. | Land | Improvement |
|---|---|---|---|---|
| 2025 | $5,747 | $434,700 | $204,300 | $230,400 |
| 2024 | $5,600 | $414,500 | $220,200 | $194,300 |
| 2023 | $5,468 | $384,800 | $209,600 | $175,200 |
| 2022 | $5,211 | $358,900 | $187,900 | $171,000 |
| 2021 | $5,015 | $340,200 | $178,500 | $161,700 |
| 2020 | $4,861 | $333,600 | $178,500 | $155,100 |
| 2019 | $4,758 | $323,700 | $179,000 | $144,700 |
| 2018 | $4,547 | $312,100 | $170,000 | $142,100 |
| 2017 | $4,416 | $293,600 | $167,200 | $126,400 |
| 2016 | $4,405 | $297,200 | $161,000 | $136,200 |
| 2015 | $3,892 | $256,200 | $120,000 | $136,200 |
| 2014 | $3,840 | $256,200 | $120,000 | $136,200 |
Source: Public Records
Map
Nearby Homes
- 12 Community Way
- 1 Revere Dr
- 35 Independence Dr Unit 35
- 9 Independence Dr Unit 9
- 132 Cannon Forge Dr
- 170 Cannon Forge Dr
- 261 East St
- Lot One Old Wolomolopoag St
- Lot Two Old Wolomolopoag St
- 89 Oak St
- 52 Condor Rd
- 260 Massapoag Ave
- 218 Massapoag Ave
- 14 Winter St Unit B
- 18 Winter St Unit E
- 3 Nicole Rd
- 11 W Belcher Rd Unit 2
- 3 Cushing Ln
- 619 N Main St
- 84 Cocasset St Unit A6