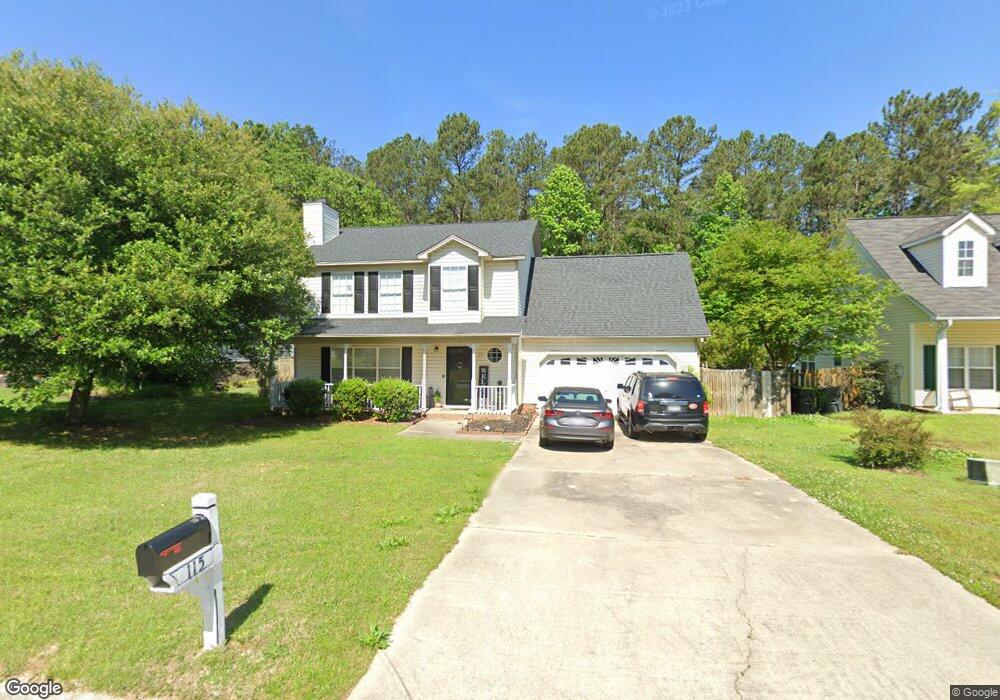
115 Elm Creek Dr Chapin, SC 29036
Estimated Value: $297,000 - $310,000
4
Beds
3
Baths
1,895
Sq Ft
$159/Sq Ft
Est. Value
About This Home
This home is located at 115 Elm Creek Dr, Chapin, SC 29036 and is currently estimated at $300,770, approximately $158 per square foot. 115 Elm Creek Dr is a home located in Lexington County with nearby schools including Chapin Elementary School, Chapin Intermediate, and Chapin High School.
Ownership History
Date
Name
Owned For
Owner Type
Purchase Details
Closed on
Sep 17, 2021
Sold by
Ares Mark and Ares Mark Douglas
Bought by
Crumpton Nicole
Current Estimated Value
Home Financials for this Owner
Home Financials are based on the most recent Mortgage that was taken out on this home.
Original Mortgage
$246,905
Outstanding Balance
$224,665
Interest Rate
2.8%
Mortgage Type
New Conventional
Estimated Equity
$76,105
Purchase Details
Closed on
Dec 23, 2008
Sold by
Ares Jennifer
Bought by
Ares Mark Douglas
Home Financials for this Owner
Home Financials are based on the most recent Mortgage that was taken out on this home.
Original Mortgage
$7,500
Interest Rate
5.95%
Mortgage Type
New Conventional
Purchase Details
Closed on
Sep 2, 2003
Sold by
Forest Brooke Llc
Bought by
Ares Mark
Purchase Details
Closed on
Aug 29, 2003
Sold by
Greene Travis H
Bought by
Ridenour Kevin G
Create a Home Valuation Report for This Property
The Home Valuation Report is an in-depth analysis detailing your home's value as well as a comparison with similar homes in the area
Home Values in the Area
Average Home Value in this Area
Purchase History
| Date | Buyer | Sale Price | Title Company |
|---|---|---|---|
| Crumpton Nicole | $259,900 | None Available | |
| Ares Mark Douglas | -- | -- | |
| Ares Mark | $139,900 | -- | |
| Ridenour Kevin G | $95,500 | -- |
Source: Public Records
Mortgage History
| Date | Status | Borrower | Loan Amount |
|---|---|---|---|
| Open | Crumpton Nicole | $246,905 | |
| Previous Owner | Ares Mark Douglas | $7,500 |
Source: Public Records
Tax History Compared to Growth
Tax History
| Year | Tax Paid | Tax Assessment Tax Assessment Total Assessment is a certain percentage of the fair market value that is determined by local assessors to be the total taxable value of land and additions on the property. | Land | Improvement |
|---|---|---|---|---|
| 2024 | $1,596 | $10,396 | $1,000 | $9,396 |
| 2023 | $1,591 | $10,396 | $1,000 | $9,396 |
| 2022 | $1,606 | $10,396 | $1,000 | $9,396 |
| 2020 | $4,162 | $9,918 | $1,500 | $8,418 |
| 2019 | $4,054 | $9,363 | $1,500 | $7,863 |
| 2018 | $3,866 | $9,363 | $1,500 | $7,863 |
| 2017 | $3,835 | $9,363 | $1,500 | $7,863 |
| 2016 | $3,808 | $9,361 | $1,500 | $7,861 |
| 2014 | $3,932 | $10,074 | $1,800 | $8,274 |
| 2013 | -- | $10,070 | $1,800 | $8,270 |
Source: Public Records
Map
Nearby Homes
- 171 Elm Creek Dr
- 0 Dreher Island Rd Unit 21647709
- 0 Dreher Island Rd Unit 587193
- 129 Monroe Preserve Dr
- 0 Mainsail Ln Unit 622256
- 100 Palm St
- 117 Bay Front Dr
- 125 Northshore Dr
- 153 Rushton Dr
- 1533 Saugus Ct
- 412 Northshore Ct
- 814 Dutchmaster Dr
- 1431 Saugus Ct
- 417 Northshore Ct
- 147 Stuck's Point
- 228 Bickley View Ct
- 510 Lilypad Ct
- 357 Chapin Place Way
- 358 Chapin Place Way
- 354 Chapin Place Way
- 119 Elm Creek Dr
- 111 Elm Creek Dr
- 123 Elm Creek Dr
- 123 Elm Creek Dr
- 101 Tanner Ct
- 107 Elm Creek Dr
- 116 Elm Creek Dr
- 127 Elm Creek Dr
- 200 Elm Creek Ct
- 102 Elm Creek Dr
- 206 Elm Creek Ct
- 131 Elm Creek Dr
- 212 Elm Creek Ct
- 2409 Hadley Crossing
- 2367 Hadley Crossing
- 109 Tanner Ct
- 218 Elm Creek Ct
- 135 Elm Creek Dr
- 104 Tanner Ct
- 108 Tanner Ct