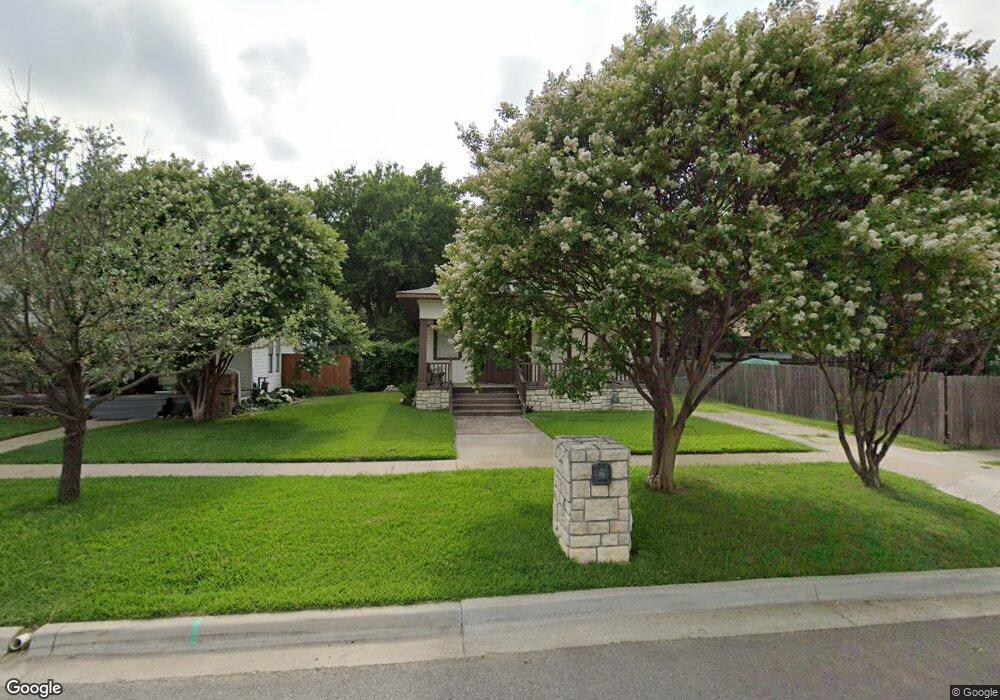
115 F St SW Ardmore, OK 73401
Estimated Value: $136,199 - $174,000
2
Beds
2
Baths
1,500
Sq Ft
$103/Sq Ft
Est. Value
About This Home
This home is located at 115 F St SW, Ardmore, OK 73401 and is currently estimated at $154,300, approximately $102 per square foot. 115 F St SW is a home located in Carter County with nearby schools including Lincoln Elementary School, Ardmore Middle School, and Ardmore High School.
Ownership History
Date
Name
Owned For
Owner Type
Purchase Details
Closed on
Oct 12, 2006
Sold by
Kirkes Hesston Lyle and Kirkes Demarae Marie
Bought by
Huff Michael L and Huff Ashley L
Current Estimated Value
Home Financials for this Owner
Home Financials are based on the most recent Mortgage that was taken out on this home.
Original Mortgage
$65,000
Outstanding Balance
$38,744
Interest Rate
6.44%
Mortgage Type
New Conventional
Estimated Equity
$115,556
Purchase Details
Closed on
Dec 22, 2005
Sold by
Khaladj Masoud T and Khaladj Letha L
Bought by
Kirkes Hesston Lyle
Home Financials for this Owner
Home Financials are based on the most recent Mortgage that was taken out on this home.
Original Mortgage
$86,355
Interest Rate
6.3%
Mortgage Type
FHA
Purchase Details
Closed on
Sep 23, 2004
Sold by
Vonrodenstein Paul A And
Bought by
Khaladj Masoud T and Khaladj Leth
Purchase Details
Closed on
Mar 10, 1995
Sold by
Jagger Richard L
Bought by
Vonrodenstein Paul And
Create a Home Valuation Report for This Property
The Home Valuation Report is an in-depth analysis detailing your home's value as well as a comparison with similar homes in the area
Home Values in the Area
Average Home Value in this Area
Purchase History
| Date | Buyer | Sale Price | Title Company |
|---|---|---|---|
| Huff Michael L | $96,000 | -- | |
| Kirkes Hesston Lyle | $87,500 | -- | |
| Khaladj Masoud T | $70,000 | -- | |
| Vonrodenstein Paul And | $25,000 | -- |
Source: Public Records
Mortgage History
| Date | Status | Borrower | Loan Amount |
|---|---|---|---|
| Open | Huff Michael L | $65,000 | |
| Previous Owner | Kirkes Hesston Lyle | $86,355 |
Source: Public Records
Tax History Compared to Growth
Tax History
| Year | Tax Paid | Tax Assessment Tax Assessment Total Assessment is a certain percentage of the fair market value that is determined by local assessors to be the total taxable value of land and additions on the property. | Land | Improvement |
|---|---|---|---|---|
| 2024 | $1,337 | $12,759 | $1,800 | $10,959 |
| 2023 | $1,273 | $12,151 | $1,800 | $10,351 |
| 2022 | $1,106 | $11,573 | $1,800 | $9,773 |
| 2021 | $1,112 | $11,022 | $1,800 | $9,222 |
| 2020 | $1,073 | $10,794 | $2,400 | $8,394 |
| 2019 | $1,048 | $10,794 | $2,400 | $8,394 |
| 2018 | $1,066 | $10,794 | $2,400 | $8,394 |
| 2017 | $987 | $10,794 | $2,400 | $8,394 |
| 2016 | $1,288 | $13,820 | $948 | $12,872 |
| 2015 | $1,011 | $13,162 | $250 | $12,912 |
| 2014 | $1,122 | $12,535 | $250 | $12,285 |
Source: Public Records
Map
Nearby Homes