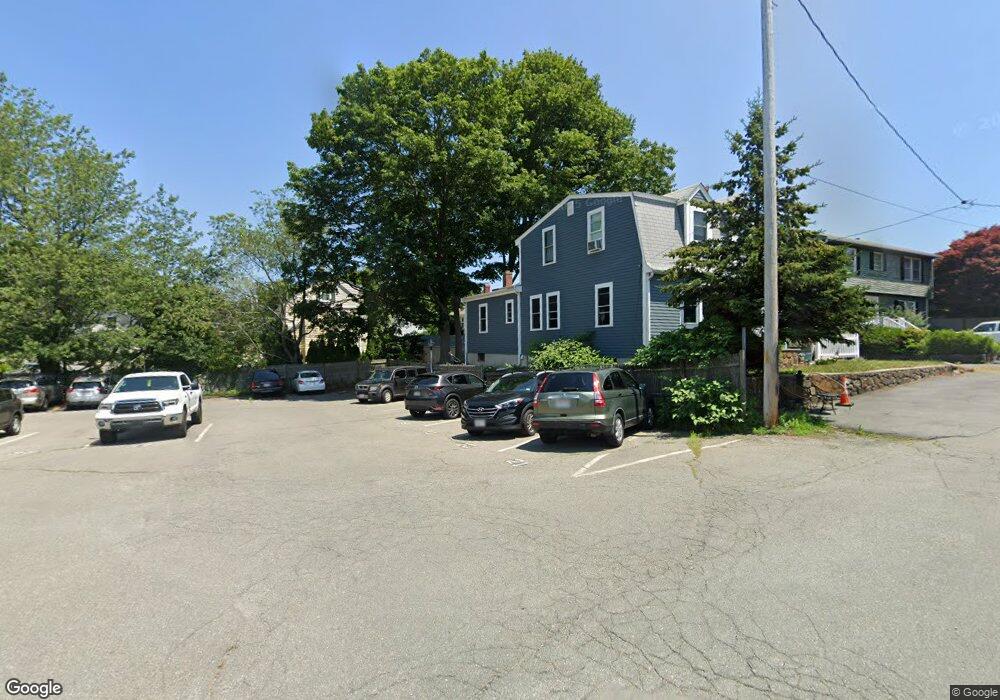
115 Farrell Ct Marblehead, MA 01945
Estimated Value: $678,000 - $842,843
2
Beds
2
Baths
1,608
Sq Ft
$476/Sq Ft
Est. Value
About This Home
This home is located at 115 Farrell Ct, Marblehead, MA 01945 and is currently estimated at $764,961, approximately $475 per square foot. 115 Farrell Ct is a home located in Essex County with nearby schools including Marblehead High School, Marblehead Community Charter Public School, and Devereux School.
Ownership History
Date
Name
Owned For
Owner Type
Purchase Details
Closed on
Jan 9, 2020
Sold by
Person Nancy T
Bought by
Nancy T Person Lt
Current Estimated Value
Purchase Details
Closed on
May 21, 1998
Sold by
Titus Mary F Est
Bought by
Person Nancy T
Home Financials for this Owner
Home Financials are based on the most recent Mortgage that was taken out on this home.
Original Mortgage
$110,000
Interest Rate
7.03%
Mortgage Type
Purchase Money Mortgage
Create a Home Valuation Report for This Property
The Home Valuation Report is an in-depth analysis detailing your home's value as well as a comparison with similar homes in the area
Home Values in the Area
Average Home Value in this Area
Purchase History
| Date | Buyer | Sale Price | Title Company |
|---|---|---|---|
| Nancy T Person Lt | -- | None Available | |
| Nancy T Person Lt | -- | None Available | |
| Nancy T Person Lt | -- | None Available | |
| Person Nancy T | $185,000 | -- | |
| Person Nancy T | $185,000 | -- |
Source: Public Records
Mortgage History
| Date | Status | Borrower | Loan Amount |
|---|---|---|---|
| Previous Owner | Person Nancy T | $10,000 | |
| Previous Owner | Person Nancy T | $105,000 | |
| Previous Owner | Person Nancy T | $110,000 | |
| Closed | Person Nancy T | $25,000 |
Source: Public Records
Tax History
| Year | Tax Paid | Tax Assessment Tax Assessment Total Assessment is a certain percentage of the fair market value that is determined by local assessors to be the total taxable value of land and additions on the property. | Land | Improvement |
|---|---|---|---|---|
| 2025 | $6,942 | $767,100 | $517,500 | $249,600 |
| 2024 | $6,589 | $735,400 | $494,500 | $240,900 |
| 2023 | $6,631 | $663,100 | $471,500 | $191,600 |
| 2022 | $6,023 | $572,500 | $385,300 | $187,200 |
| 2021 | $5,755 | $552,300 | $368,000 | $184,300 |
| 2020 | $5,686 | $547,300 | $368,000 | $179,300 |
| 2019 | $5,427 | $505,300 | $333,500 | $171,800 |
| 2018 | $5,315 | $482,300 | $310,500 | $171,800 |
| 2017 | $4,930 | $447,800 | $276,000 | $171,800 |
| 2016 | $4,770 | $429,700 | $264,500 | $165,200 |
| 2015 | $4,674 | $421,800 | $253,000 | $168,800 |
| 2014 | $4,181 | $377,000 | $218,500 | $158,500 |
Source: Public Records
Map
Nearby Homes
- 3 Frost Ln Unit 1
- 7 Mechanic Ct
- 45 Pleasant St
- 132 Elm St
- 132 Elm St Unit 132
- 9 Lincoln Park
- 26 Summer St Unit 1
- 9 Darling St
- 66 Pleasant St Unit 1
- 66 Pleasant St Unit 2
- 55 Roosevelt Ave
- 157 Green St Unit 3
- 6 Mount Vernon St
- 290 Washington St Unit A
- 55 Brackett Place Unit B
- 41 Atlantic Ave Unit 1
- 7 Cottage St
- 4 Broadmere Way
- 1 Knollwood Rd
- 21 Kenneth Rd
- 117 Farrell Ct Unit B
- 117 Farrell Ct Unit A
- 2 Peach Highlands
- 4 Peach Highlands
- 26 Pond St
- 24 Pond St
- 24 Pond St Unit 1
- 118 Farrell Ct Unit 118
- 114 Farrell Ct
- 116 Farrell Ct
- 118 Farrell Ct
- 118 Farrell Ct Unit A
- 118 Farrell Ct
- 30 Pond St
- 8 Peach Highlands
- 22 Pond St
- 0 Pond St Unit L
- 0 Pond St Unit 3
- 0 Pond St
- 20 Pond St Unit 6
Your Personal Tour Guide
Ask me questions while you tour the home.