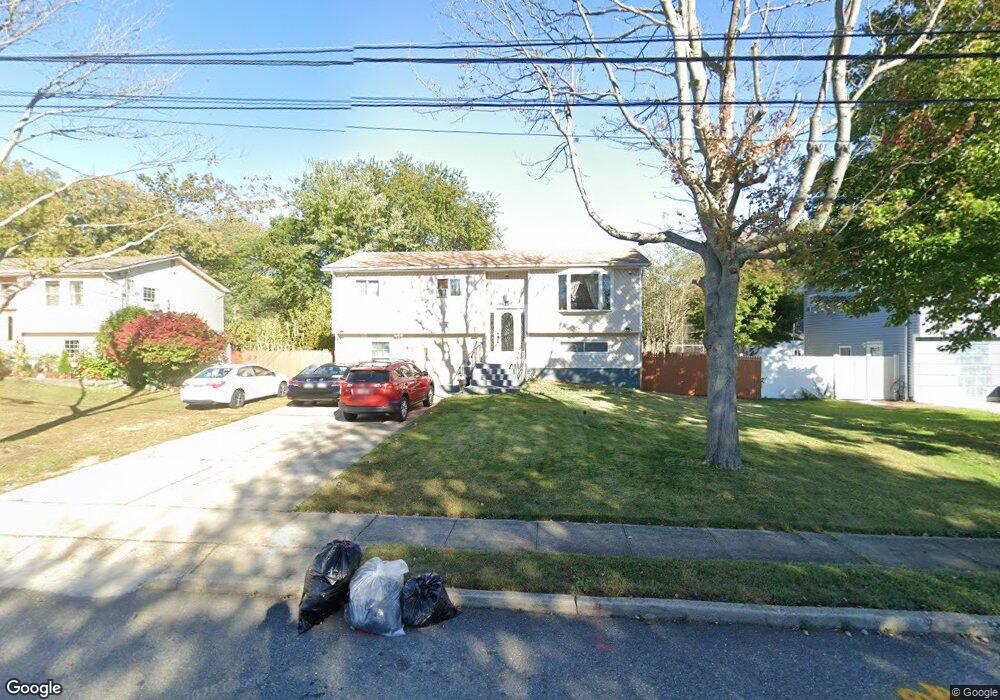
115 Ferris Ave Brentwood, NY 11717
Estimated Value: $622,000 - $709,000
4
Beds
2
Baths
2,141
Sq Ft
$302/Sq Ft
Est. Value
About This Home
This home is located at 115 Ferris Ave, Brentwood, NY 11717 and is currently estimated at $646,661, approximately $302 per square foot. 115 Ferris Ave is a home located in Suffolk County with nearby schools including MDQ Academy.
Ownership History
Date
Name
Owned For
Owner Type
Purchase Details
Closed on
Jan 30, 2018
Sold by
Jeannis Mesmer F and Jeannis Javenis
Bought by
Reyes Mirma R and Rodriguez-Velasquz Romel
Current Estimated Value
Home Financials for this Owner
Home Financials are based on the most recent Mortgage that was taken out on this home.
Original Mortgage
$338,751
Outstanding Balance
$286,603
Interest Rate
3.95%
Mortgage Type
Stand Alone Refi Refinance Of Original Loan
Estimated Equity
$360,058
Purchase Details
Closed on
Aug 21, 1995
Sold by
Garcia Oscar and Garcia Phyllis
Bought by
Jeannis Mesmer F and Jeannis Javenise
Create a Home Valuation Report for This Property
The Home Valuation Report is an in-depth analysis detailing your home's value as well as a comparison with similar homes in the area
Home Values in the Area
Average Home Value in this Area
Purchase History
| Date | Buyer | Sale Price | Title Company |
|---|---|---|---|
| Reyes Mirma R | -- | -- | |
| Jeannis Mesmer F | $135,000 | Stewart Title Insurance Co |
Source: Public Records
Mortgage History
| Date | Status | Borrower | Loan Amount |
|---|---|---|---|
| Open | Reyes Mirma R | $338,751 |
Source: Public Records
Tax History Compared to Growth
Tax History
| Year | Tax Paid | Tax Assessment Tax Assessment Total Assessment is a certain percentage of the fair market value that is determined by local assessors to be the total taxable value of land and additions on the property. | Land | Improvement |
|---|---|---|---|---|
| 2024 | $9,988 | $38,900 | $7,600 | $31,300 |
| 2023 | $9,988 | $38,900 | $7,600 | $31,300 |
| 2022 | $7,838 | $38,900 | $7,600 | $31,300 |
| 2021 | $7,838 | $38,900 | $7,600 | $31,300 |
| 2020 | $8,745 | $38,900 | $7,600 | $31,300 |
| 2019 | $8,745 | $0 | $0 | $0 |
| 2018 | -- | $36,500 | $7,600 | $28,900 |
| 2017 | $8,503 | $38,500 | $7,600 | $30,900 |
| 2016 | $8,403 | $38,500 | $7,600 | $30,900 |
| 2015 | -- | $38,500 | $7,600 | $30,900 |
| 2014 | -- | $38,500 | $7,600 | $30,900 |
Source: Public Records
Map
Nearby Homes