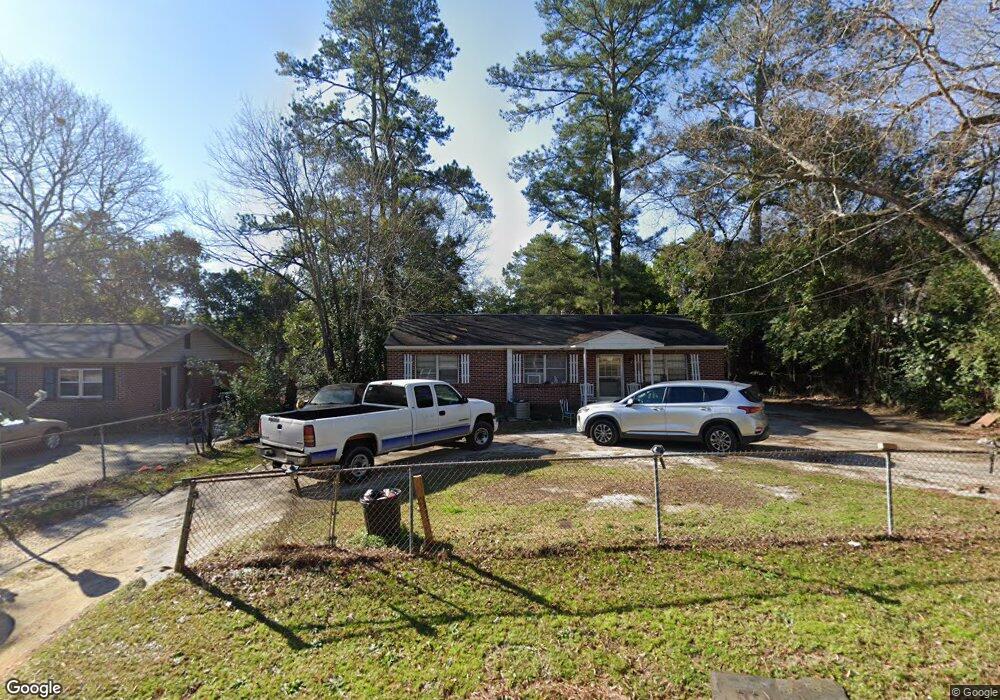
115 Flanders Dr Warner Robins, GA 31093
Estimated Value: $82,000 - $109,000
--
Bed
1
Bath
984
Sq Ft
$97/Sq Ft
Est. Value
About This Home
This home is located at 115 Flanders Dr, Warner Robins, GA 31093 and is currently estimated at $95,389, approximately $96 per square foot. 115 Flanders Dr is a home located in Houston County with nearby schools including Lindsey Elementary School, Northside Middle School, and Northside High School.
Ownership History
Date
Name
Owned For
Owner Type
Purchase Details
Closed on
Feb 17, 2016
Sold by
Holding Investments Llc
Bought by
Fountain Joe Louis and Fountain Isabelle T
Current Estimated Value
Home Financials for this Owner
Home Financials are based on the most recent Mortgage that was taken out on this home.
Original Mortgage
$37,600
Outstanding Balance
$29,837
Interest Rate
3.81%
Mortgage Type
New Conventional
Estimated Equity
$65,552
Purchase Details
Closed on
Mar 14, 2007
Sold by
Mortgages Williams
Bought by
Holding Investments Llc
Home Financials for this Owner
Home Financials are based on the most recent Mortgage that was taken out on this home.
Original Mortgage
$42,000
Interest Rate
6%
Mortgage Type
Seller Take Back
Purchase Details
Closed on
Mar 9, 2007
Sold by
Nash Vicki W and Williams Vicki Laverne
Bought by
Williams Christopher Thomas
Home Financials for this Owner
Home Financials are based on the most recent Mortgage that was taken out on this home.
Original Mortgage
$42,000
Interest Rate
6%
Mortgage Type
Seller Take Back
Purchase Details
Closed on
Sep 24, 1987
Bought by
Williams C L
Create a Home Valuation Report for This Property
The Home Valuation Report is an in-depth analysis detailing your home's value as well as a comparison with similar homes in the area
Home Values in the Area
Average Home Value in this Area
Purchase History
| Date | Buyer | Sale Price | Title Company |
|---|---|---|---|
| Fountain Joe Louis | $39,600 | -- | |
| Holding Investments Llc | $42,000 | None Available | |
| Mortgages Williams | -- | None Available | |
| Williams Christopher Thomas | -- | None Available | |
| Williams C L | $31,200 | -- |
Source: Public Records
Mortgage History
| Date | Status | Borrower | Loan Amount |
|---|---|---|---|
| Open | Fountain Joe Louis | $37,600 | |
| Previous Owner | Mortgages Williams | $42,000 |
Source: Public Records
Tax History Compared to Growth
Tax History
| Year | Tax Paid | Tax Assessment Tax Assessment Total Assessment is a certain percentage of the fair market value that is determined by local assessors to be the total taxable value of land and additions on the property. | Land | Improvement |
|---|---|---|---|---|
| 2024 | $719 | $21,960 | $5,000 | $16,960 |
| 2023 | $538 | $16,320 | $2,520 | $13,800 |
| 2022 | $344 | $14,960 | $2,520 | $12,440 |
| 2021 | $294 | $12,720 | $2,520 | $10,200 |
| 2020 | $305 | $13,120 | $2,520 | $10,600 |
| 2019 | $305 | $13,120 | $2,520 | $10,600 |
| 2018 | $305 | $13,120 | $2,520 | $10,600 |
| 2017 | $305 | $13,120 | $2,520 | $10,600 |
| 2016 | $306 | $13,120 | $2,520 | $10,600 |
| 2015 | -- | $13,120 | $2,520 | $10,600 |
| 2014 | -- | $13,120 | $2,520 | $10,600 |
| 2013 | -- | $13,120 | $2,520 | $10,600 |
Source: Public Records
Map
Nearby Homes
- 113 Flanders Dr
- 117 Flanders Dr
- 220 Madrid St
- 119 Flanders Dr
- 109 Flanders Dr
- 224 Madrid St
- 218 Madrid St
- 112 Flanders Dr
- 114 Flanders Dr
- 226 Madrid St
- 216 Madrid St
- 110 Flanders Dr
- 116 Flanders Dr
- 107 Flanders Dr
- 0 Flanders Dr
- 125 Flanders Dr
- 108 Flanders Dr
- 118 Flanders Dr
- 214 Madrid St
- 228 Madrid St