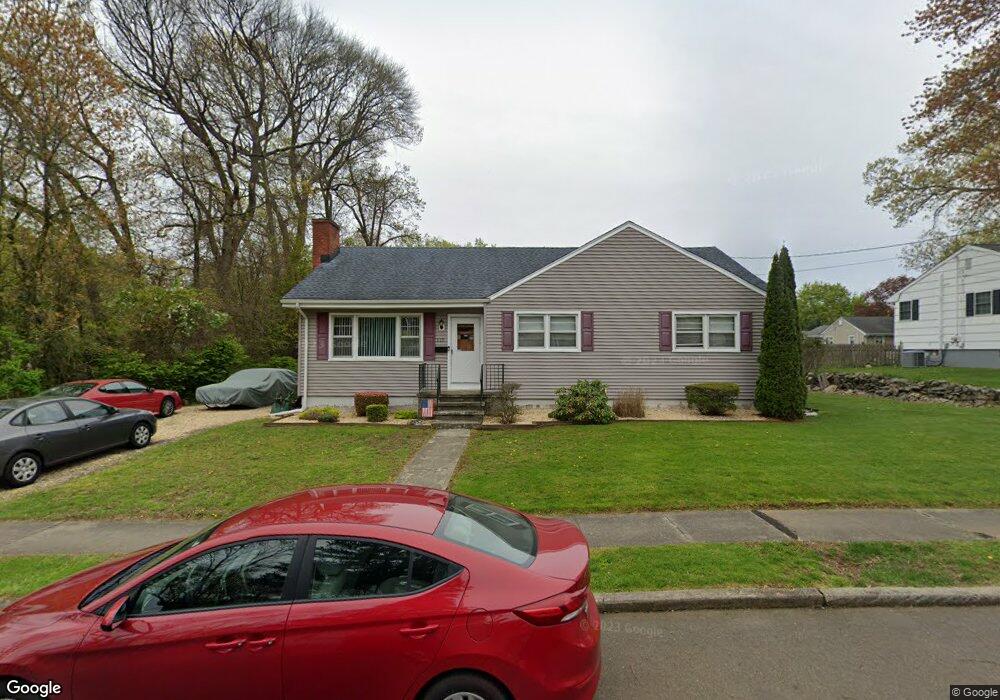
115 Flora Dr Stratford, CT 06614
Estimated Value: $395,000 - $491,000
3
Beds
2
Baths
1,594
Sq Ft
$280/Sq Ft
Est. Value
About This Home
This home is located at 115 Flora Dr, Stratford, CT 06614 and is currently estimated at $446,754, approximately $280 per square foot. 115 Flora Dr is a home located in Fairfield County with nearby schools including Eli Whitney Elementary School, Harry B. Flood Middle School, and Bunnell High School.
Ownership History
Date
Name
Owned For
Owner Type
Purchase Details
Closed on
Oct 8, 2021
Sold by
Kuroghlian Charles S and Kuroghlian Rosa
Bought by
Kuroghlian John C and Kuroghlian Peter L
Current Estimated Value
Home Financials for this Owner
Home Financials are based on the most recent Mortgage that was taken out on this home.
Original Mortgage
$204,000
Outstanding Balance
$184,407
Interest Rate
2.8%
Mortgage Type
Purchase Money Mortgage
Estimated Equity
$262,347
Purchase Details
Closed on
Jun 1, 2000
Sold by
Moran Jonathan and Starbuck Samantha
Bought by
Williams Kevin and Williams Kristin
Purchase Details
Closed on
Apr 19, 1990
Sold by
Lyons Theresa
Bought by
Kuroglian Charles
Create a Home Valuation Report for This Property
The Home Valuation Report is an in-depth analysis detailing your home's value as well as a comparison with similar homes in the area
Home Values in the Area
Average Home Value in this Area
Purchase History
| Date | Buyer | Sale Price | Title Company |
|---|---|---|---|
| Kuroghlian John C | $255,000 | None Available | |
| Williams Kevin | $353,399 | -- | |
| Kuroglian Charles | $85,000 | -- |
Source: Public Records
Mortgage History
| Date | Status | Borrower | Loan Amount |
|---|---|---|---|
| Open | Kuroghlian John C | $204,000 | |
| Previous Owner | Kuroglian Charles | $100,000 | |
| Previous Owner | Kuroglian Charles | $75,000 | |
| Previous Owner | Kuroglian Charles | $26,700 |
Source: Public Records
Tax History
| Year | Tax Paid | Tax Assessment Tax Assessment Total Assessment is a certain percentage of the fair market value that is determined by local assessors to be the total taxable value of land and additions on the property. | Land | Improvement |
|---|---|---|---|---|
| 2025 | $7,117 | $177,030 | $100,450 | $76,580 |
| 2024 | $7,117 | $177,030 | $100,450 | $76,580 |
| 2023 | $7,117 | $177,030 | $100,450 | $76,580 |
| 2022 | $6,986 | $177,030 | $100,450 | $76,580 |
| 2021 | $6,987 | $177,030 | $100,450 | $76,580 |
| 2020 | $7,017 | $177,030 | $100,450 | $76,580 |
| 2019 | $6,684 | $167,650 | $85,610 | $82,040 |
| 2018 | $6,689 | $167,650 | $85,610 | $82,040 |
| 2017 | $6,701 | $167,650 | $85,610 | $82,040 |
| 2016 | $6,537 | $167,650 | $85,610 | $82,040 |
| 2015 | $6,200 | $167,650 | $85,610 | $82,040 |
| 2014 | $6,335 | $177,800 | $91,980 | $85,820 |
Source: Public Records
Map
Nearby Homes
- 670 Wigwam Ln
- 1414 Huntington Rd
- 135 Wigwam Ln
- 25 Fairchild Rd
- 120 Barton Dr
- 130 Wainwright Place
- 165 Douglas St
- 260 Overland Dr
- 185 Cutspring Rd
- 175 Post Oak Rd
- 700 Huntington Rd
- 280 Goldbach Dr
- 244 Rockland Ave
- 15 Ferndale Place
- 183 Burbank Ave
- 5060 Main St
- 52 Circle Dr
- 170 Pumpkin Ground Rd
- 419 Huntington Rd
- 86 Parkway Dr
Your Personal Tour Guide
Ask me questions while you tour the home.